Utility Tool
Please note that the type of utility tools you can use depends on licensed software.
scMonitor
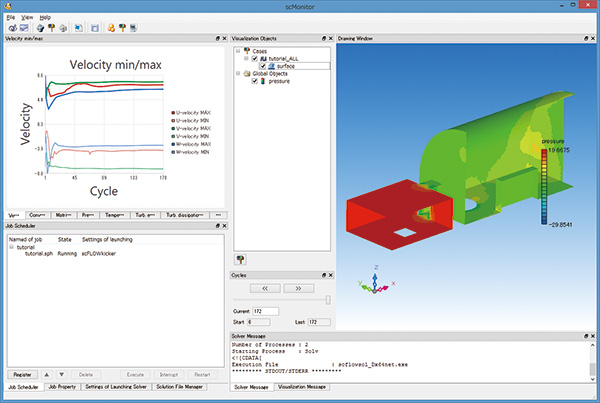
You can visualize the progress of the simulations in scMonitor during the Solver calculations. You can check, for example, pressure contour of a registered surface and temperature contour and flow vector on axial planes.
* To use this function, a Postprocessor license is required in some areas.
LFileView
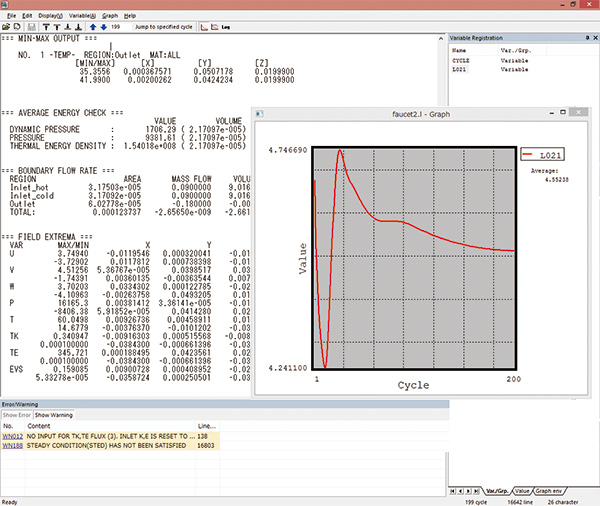
LFileView is a dedicated viewer for L files, which are output during the simulations automatically. You can check the progress of the simulations numerically with variable values for each cycle and the maximum/minimum/average values for the specified output.
VB Interface
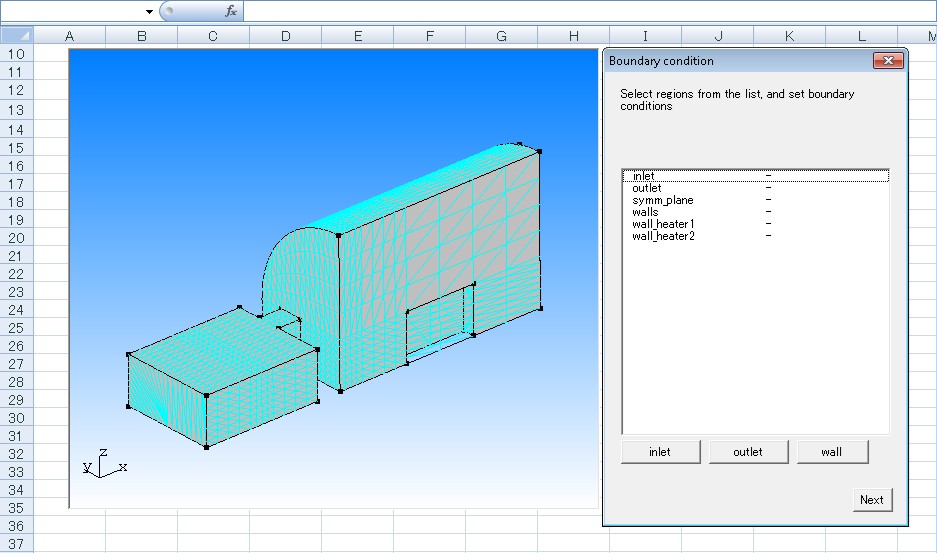
The software supports COM technology provided by Microsoft. You can control the software by using Microsoft Office products and Visual Basic (VB).
- Tool to create a report automatically
- Unique GUI
- Tool to create a model from the 2D data automatically
Parametric Study Tool
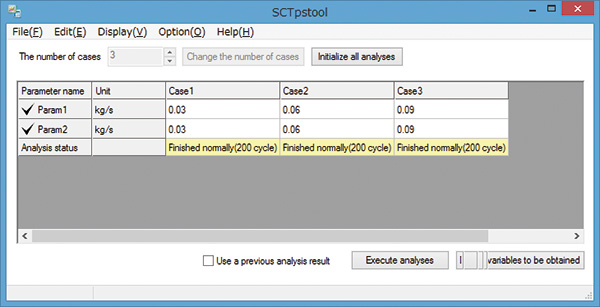
Using the parametric study tool, you can set analysis conditions to multiple cases all at once - for instance, when you run several calculations with modified parameters such as flow rate or amount of heat. The interface is user-friendly with spreadsheet-like settings. You can check, in the same interface, the status of each case and the output parameters such as the maximum/minimum temperature or average pressure on a specified plane.
* This tool is available in scSTREAM, HeatDesigner, and SC/Tetra
HeatPathView
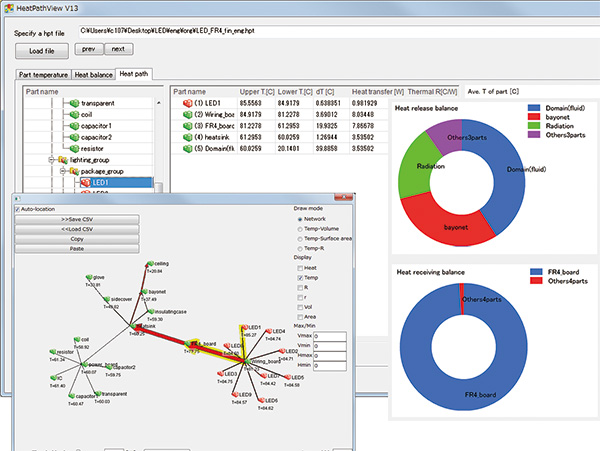
Using HeatPathView, you can review heat dissipation measures with focus on each component. The tool enables the intuitive and comprehensive evaluation of heat balance and search of heat dissipation paths. By understanding the flow of heat, you can make your heat dissipation designs more reliable.
CradleViewer
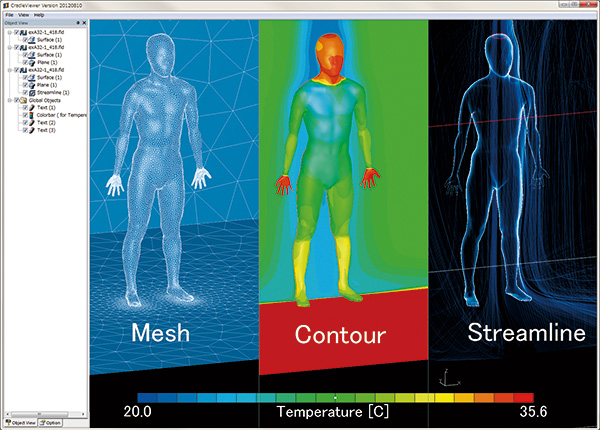
The simulation result visualized in Postprocessor can be saved in a file and the file can be opened in a simple viewer. In the viewer, the viewpoint ant the distance can be changed with the mouse and by touch operation*1. CradleViewer is provided free of charge. You can share the simulation result even in an environment without Postprocessor installed. CradleViewer is also compatible with VR/MR devices*2 and iPad, allowing users to visually verify analysis results.
*1 Operation using two fingers is supported on a multitouch-compatible screen in a Windows 10 environment.
*2 Compatible with Oculus Rift CV1 during VR mode.
scCONVERTER
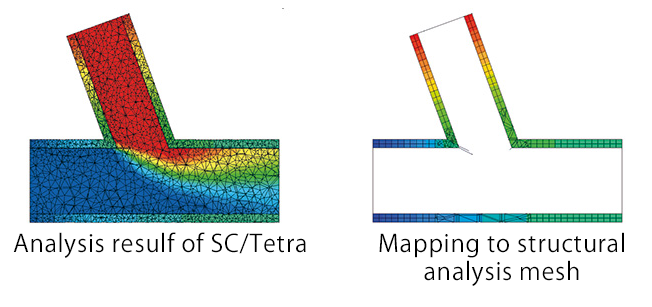
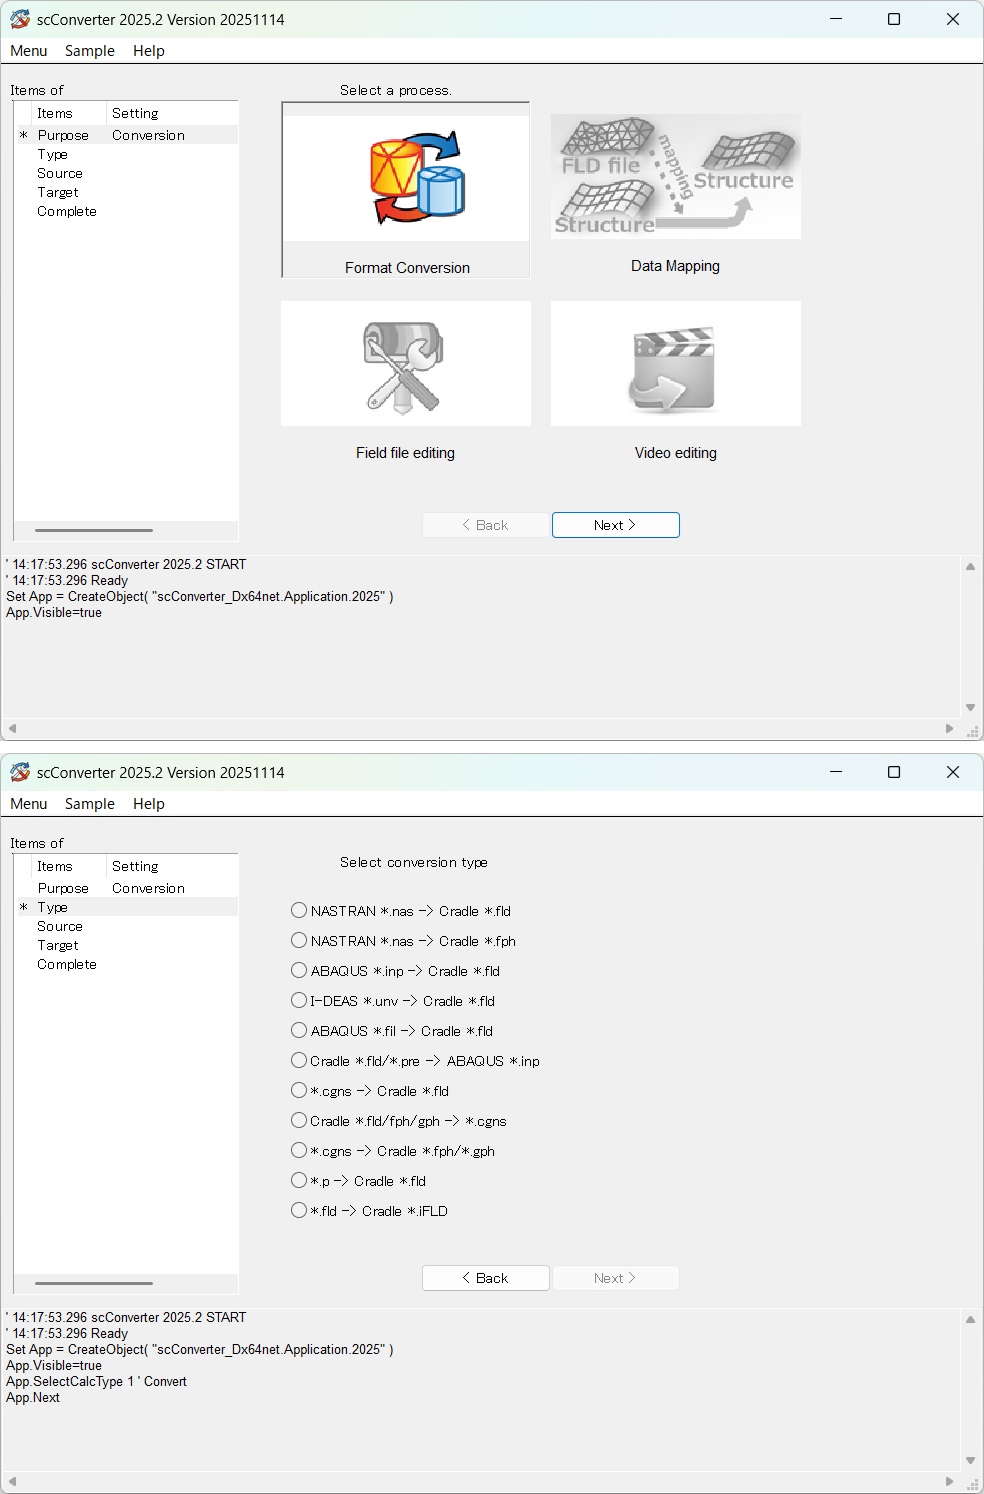
Data (FLD/FPH files) such as pressure, temperature, and heat transfer coefficient obtained in thermo-fluid analyses can be mapped to input data of structural analysis software (Abaqus, I-DEAS, Nastran). In addition, input data of structural analyses can be converted to an FLD or FPH file. scCONVERTER can create an animation file from multiple still images (BMP/PNG files), edit FLD/FPH files, and convert a P file to an FLD file or an FLD file to an iFLD file.
