Basic Course of Thermo-Fluid Analysis 07: Chapter 3 Basics of Flow - 3.2.2 Steady state and transient state, 3.2.3 Bernoulli's theory
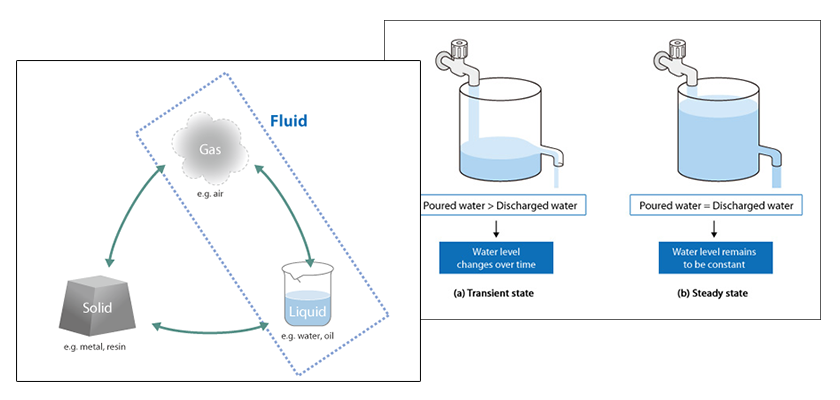
Chapter 3 Basics of Flow IV
3.2.2 Steady state and transient state
Consider the situation where water is poured into a container which has an outlet part on the side of the container as shown in Figure 3.12. At first when the water level is below the outlet, the water level in the container rises with time as shown in (a). However, when the water level reaches a certain height, the amount of water entering the tank and the amount of discharged water are balanced and the water level remains constant (See [b]).
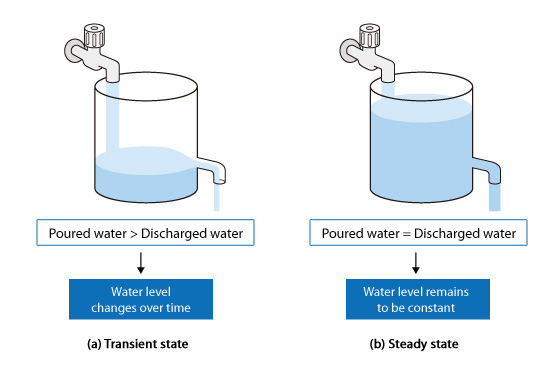
Figure 3.12: Water level change
When the state of the system changes with time, this is called the transient state as shown in [a]. On the other hand, when the state is constant with time, this is called the steady state. You must identify the correct state before performing a thermo-fluid analysis.
In a steady-state analysis, only a steady-state solution is obtained. The analysis cannot predict how the process achieved the steady-state condition. If the thermo-fluid analysis is terminated before the analysis reaches the steady-state solution, the result does not have any physical meaning.
On the other hand, a transient analysis accurately calculates the system conditions as it changes with time. Therefore, the transient analysis calculates the time variation of a phenomenon. If the transient analysis is permitted to run for a long enough time, the steady-state solution will eventually be obtained. The steady-state solution will generally be obtained by using a steady-state analysis much faster than transient analysis. Therefore, if the steady-state solution is all that is needed, the calculations should be performed as a steady-state analysis.
3.2.3 Bernoulli's theory
When the fluid density is designated by the Greek symbol ρ (rho) and fluid velocity by the letter ν, the unit for ρν2/2 is the same as that for pressure. This expression represents the kinetic energy of a fluid flow and is called the dynamic pressure. In contrast, a force such as atmospheric pressure that acts on the system is called static pressure. The sum of the dynamic and static pressures is called the total pressure.
Imagine a fluid does not have any viscosity and its volume does not change. This fluid is called an ideal fluid. When the flow of an ideal fluid does not change with time, its total pressure is constant. This is called Bernoulli's theory and expresses the fluid energy conservation law. In a real flow, energy is lost due to viscosity and the total pressure decreases in the flow direction.
Consider the flow at cross-sections A and B in Figure 3.13. For an ideal fluid, the total pressure at the two cross-sections is the same as explained by Bernoulli’s theory. At cross-section A, where the area is larger, the flow velocity is lower compared to the flow velocity at cross-section B. The total mass flow is constant. Therefore, the dynamic pressure at cross-section A < dynamic pressure at cross-section B. In turn, the static pressure at cross-section A > static pressure at cross-section B since the total pressure is constant.
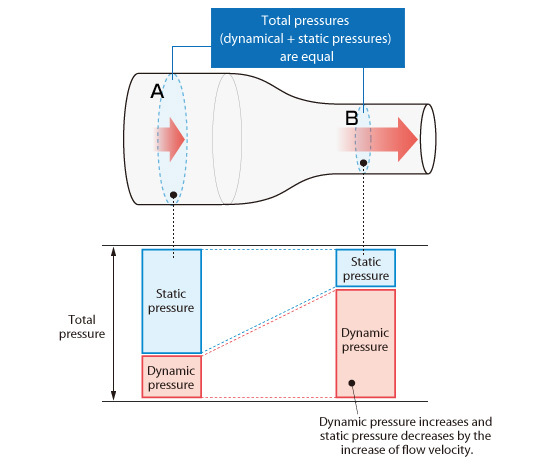
Figure 3.13: Bernoulli’s theory
A simple experiment can illustrate the Bernoulli theory. Consider two balloons as shown in Figure 3.14. Strongly blow in the space between the balloons. The balloons will come together and may even contact each other. According to Bernoulli’s theory, the balloons come together because the static pressure decreases when the velocity increases.
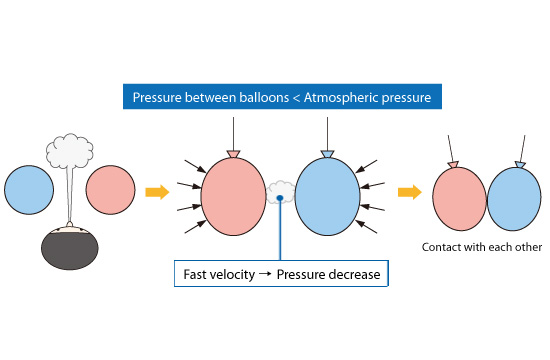
Figure 3.14: Experiment using balloons

About the Author
Atsushi Ueyama | Born in September 1983, Hyogo, Japan
He has a Doctor of Philosophy in Engineering from Osaka University. His doctoral research focused on numerical method for fluid-solid interaction problem. He is a consulting engineer at Software Cradle and provides technical support to Cradle customers. He is also an active lecturer at Cradle seminars and training courses.

