Basic Course of Thermo-Fluid Analysis 05: Chapter 3 Basics of Flow - 3.1.3 Streamlines, streaklines, and pathlines
Chapter 3 Basics of Flow II
3.1.3 Streamlines, streaklines, and pathlines
Visualizing flow using streamlines, streaklines, or pathlines makes it more intuitively understandable.
A streamline is a line which smoothly connects velocity vectors at an instance in time. In other words, an image of the flow characterized by streamlines is like a snapshot of the flow at one moment in time.
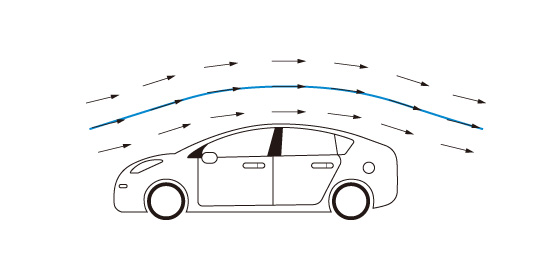
Figure 3.4: Streamline
A streakline is a curved line formed by a string of fluid particles which have passed through a certain point. An example of a streakline is the trail of smoke from a chimney.
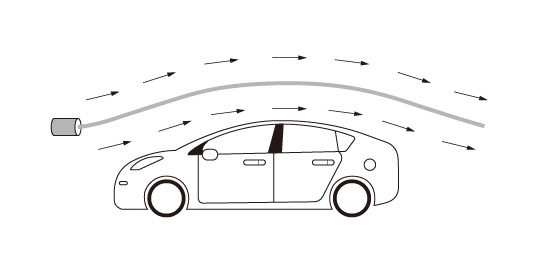
Figure 3.5: Streakline
A pathline is a path which a fluid particle traces. One example of a pathline is the path defined by a balloon floating in the air.
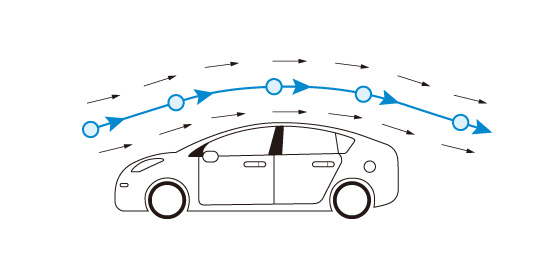
Figure 3.6: Pathline
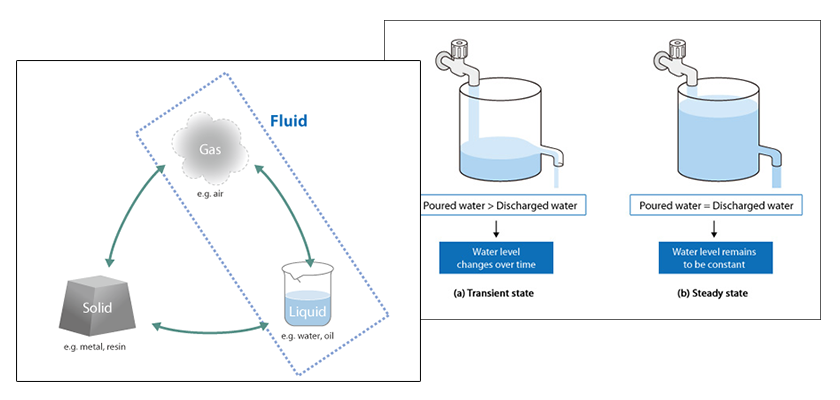
For a flow which does not change with time, the streamline, streakline, and pathline are the same line. A flow which does not change with time is called a steady-state flow . On the other hand, a flow which varies with time is called a transient flow. For transient flows, the streamline, streakline, and pathline are all different lines.
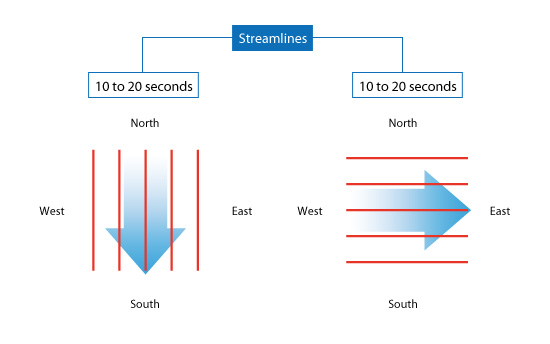
Figure 3.7: Example of streamlines
A streakline represents all the points that have passed through a certain location. For this situation, where the streakline can be likened to represent the smoke trail from a chimney, the streakline goes to the south during the first 10 seconds because all the smoke is going south. Then, when the wind shifts to the east, all the smoke particles that were initially heading south (emitted for Time < 10 seconds) start to be offset to the east. The newer smoke particles (emitted for Time > 10 seconds) head directly east. After 20 seconds the streakline is at a right angle as shown on the right in Figure 3.8.
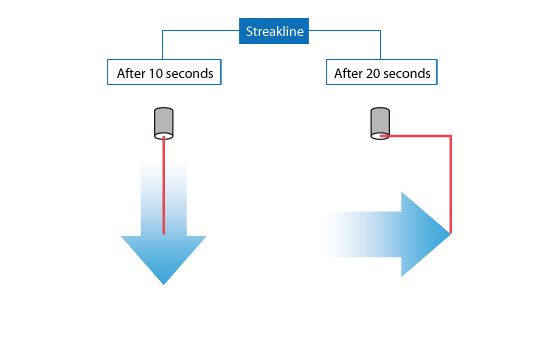
Figure 3.8: Example of a streakline
A pathline goes to the south during the first 10 seconds just as the streakline. The pathline can be thought of as the path traced by a balloon floating in the air. When the wind shifts to the east, the balloon starts moving east. The pathline goes to the east from the point where the wind direction has been changed. As a result, after 20 seconds the pathline bends at a right angle as shown on the right in Figure 3.9.
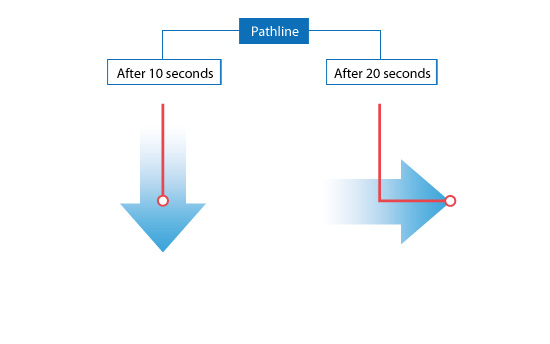
Figure 3.9: Example of a pathline
As can be seen in this chapter, the analysis results for transient flows will be different depending on the method used to visualize the flow. Understanding this difference is important when visualizing analysis and experimental results.

About the Author
Atsushi Ueyama | Born in September 1983, Hyogo, Japan
He has a Doctor of Philosophy in Engineering from Osaka University. His doctoral research focused on numerical method for fluid-solid interaction problem. He is a consulting engineer at Software Cradle and provides technical support to Cradle customers. He is also an active lecturer at Cradle seminars and training courses.

