
Master Course for Fluid Simulation Analysis of Multi-phase Flows by Oka-san: 10. Particle tracking analysis IV
Particle tracking analysis IV
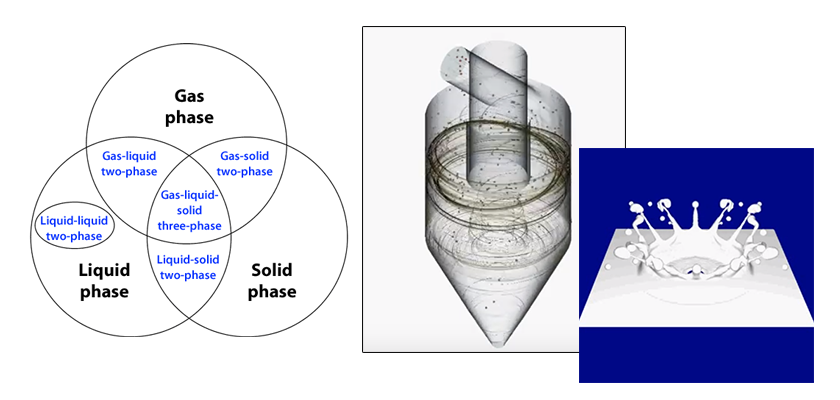
This section discusses generation of chemical species during evaporation and volatilization of particles using the particle tracking method.
Evaporation and volatilization must be modeled for reactant particles. For the spray combustion model of a fuel droplet (Figure 1), the temperature of a fuel droplet rises due to heat transfer from the hot surrounding fluid. Furthermore, the droplet will volatilize when the amount of energy equivalent to its latent heat transfers to the particle. The volatilized fuel droplet forms organic compounds in the fluid, and the compounds burn to produce carbon dioxide and water vapor.
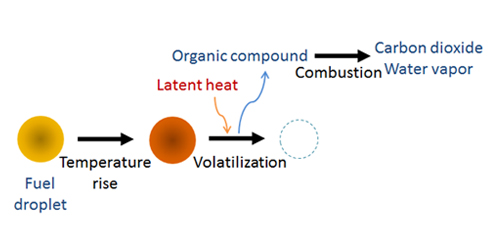
Figure 1: Spray combustion model of a fuel droplet
The Particle Source in Cell (PSI-Cell) method was discussed in a previous article . For the PSI-Cell method, a fuel droplet (particle being tracked) and the fluid (defined by mesh elements) are coupled as shown in Figure 2. As the temperature of the fuel droplet rises and the droplet volatilizes, the temperature in the fluid elements decreases. The heat transfer to the droplet and its volatilization are defined by models in the software. Frequently, the Ranz-Marshall correlation (an empirical correlation developed in 1952) is used. While the Ranz-Marshall correlation will not be discussed in detail here, the correlation does require an estimate for the vapor pressure of the volatile components of the fuel droplet. Since the volatile components volatilize from the surface of the fuel droplet, the temperature distribution and composition distribution of the fuel droplet should be considered. However, if the assumption is made that the fuel droplet has a uniform temperature and composition, the vapor pressure of the volatile component is estimated based on the mean temperature of the fuel droplet.
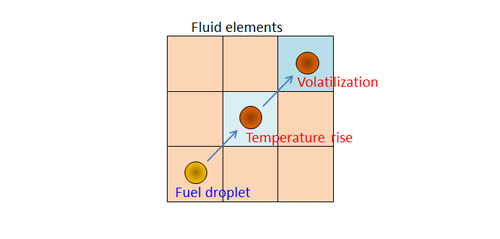
Figure 2: PSI-Cell method
To estimate the vapor pressure, the Antoine equation (an empirical equation developed in 1888) can be used. The Antoine equation requires the constants A, B, and C be defined for each substance. These constants can be found in reference books or data bases which contain Antoine equation parameters.
log10 P = A – B / ( T + C )
P Vapor pressure [ Pa ] , T Temperature [ K ]
For example, the constants A, B, and C for n-Decane (a chemical component in diesel fuel) are 6.08, 1501.27, and -78.67, respectively (the values will depend on the units of the vapor pressure and temperature).
The organic compound volatilized from the fuel droplet combines with oxygen in the fluid and burns. The eddy dissipation model, which is frequently used for fluid simulation analysis of combustion processes, plays a critical role in evaporation and volatilization and will be discussed here. The eddy dissipation model is used to simulate turbulent diffusion during combustion (see Figure 3). In diffusion combustion, the fuel (volatilized organic compound) and oxidizer (e.g., air in the fluid) are separate at the beginning of the process. They diffuse and are mixed with each other where their boundaries meet. A flame is formed at this boundary. The eddy dissipation model assumes that the chemical reaction is very fast so the burning velocity is controlled by the turbulent mixing of the fuel and air. Thus turbulent mixing is expressed by the turbulent kinetic energy and its dissipation rate obtained by using a time-averaged turbulence model.
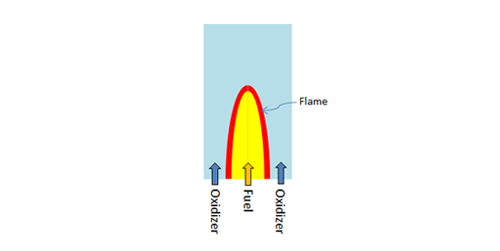
Figure 3: Diffusion combustion
Consider an example. Spray combustion of fuel droplets is analyzed using the particle tracking method. Figure 4 shows air at 500°C is entering a combustion chamber having inlet and outlet pipes. A fuel spray nozzle is mounted at the center of the inlet pipe (Spray air temperature: 27°C). A 2D axial symmetric model is used since the chamber and the nozzle have axial symmetry. The velocity of the air in the inflow pipe is 25 m/s, and the spray air velocity is 38.6 m/s. Stationary wall and adiabatic conditions (i.e., walls are insulated) are applied to all the wall surfaces.
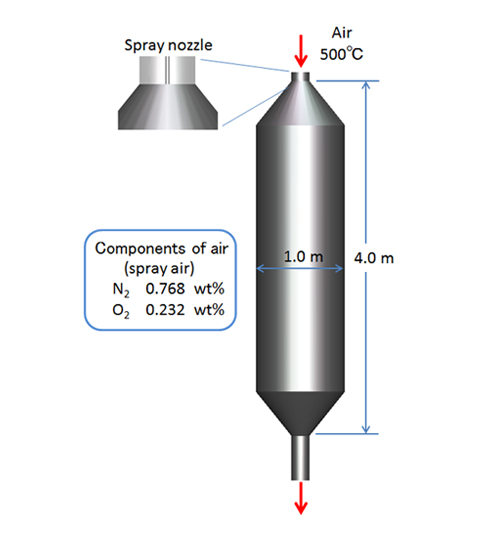
Figure 4: Combustion chamber
The Sauter mean diameter for the fuel droplets sprayed from the nozzle is 20 μm and Nukiyama-Tanazawa distribution function is applied to calculate the particle size distribution. The spray flow rate is 0.005 kg/s (Parcel approximation: 10,000 s-1 ), and the spray velocity is 15 m/s. The spray nozzle creates a hollow-cone spray, and the spray angle is 110-120°. To keep the calculation stable, only air and the spray air flow into the chamber during the first second at the beginning of the calculation. The fuel spray begins after 1 second. The latent heat of the fuel droplets is 200 kJ/kg, and the A, B, C constants for n-Decane are defined by the Antoine equation. The eddy dissipation model determines the combustion rate and the overall stoichiometric reaction is expressed as follows (Composition of the volatile organic compound: C10 H22 ):
C10 H22 + 15.5 O2 →10 CO2 + 11 H2O
In addition, radiation is included in the analysis by setting the parameters:
Emissivity of the combustion chamber wall surface: 0.6
Absorptance of the combustion gas in the chamber: 0.2
Figure 5 shows the analysis result 12 seconds into the calculation, and shows the behavior of the fuel droplets and the variation of the temperature distribution. The temperature of the combustion gas in the chamber rises due to combustion of the fuel droplets. Figure 6 shows the variation of the mass fraction distribution of the combustion gases. The figure on the left shows the mass fraction for the organic compounds. The figure on the right shows the mass fraction for carbon dioxide, a product of combustion. The figures depict the process of volatilized fuel droplets producing organic compounds that react with air in the surroundings and burn to form carbon dioxide and water vapor.
Figure 5: Behavior of the fuel droplets and the variation of the temperature distribution
Figure 6: Variation of the mass fraction distribution of the combustion gases
(organic compound on left, carbon dioxide on right)
The next article will discuss liquefaction of particles.

About the Author
Katsutaka Okamori | Born in October 1966, Tokyo, Japan
He attained a master’s degree in Applied Chemistry from Keio University. As a certified Grade 1 engineer (JSME certification) specializing in multi-phase flow evaluation, Okamori contributed to CFD program development while at Nippon Sanso (currently TAIYO NIPPON SANSO CORPORATION). He also has experience providing technical sales support for commercial software, and technical CFD support for product design and development groups at major manufacturing firms. Okamori now works as a sales engineer at Software Cradle.

