
Master Course for Fluid Simulation Analysis of Multi-phase Flows by Oka-san: 7. Particle tracking analysis I
Particle tracking analysis I
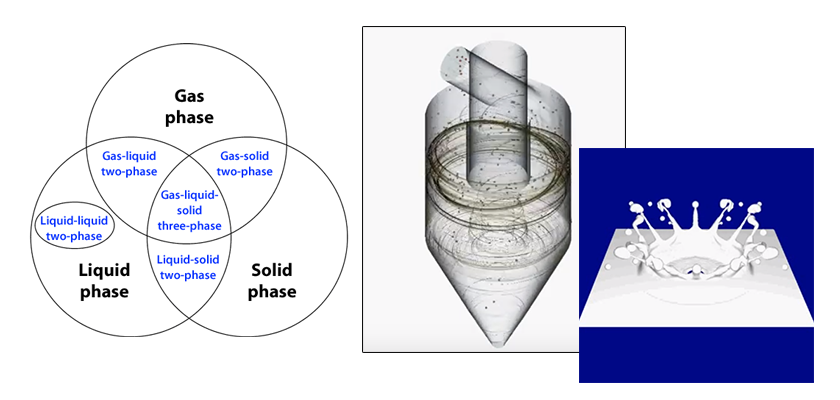
The particle tracking method is useful for multi-phase flow analyses. The behavior of particles can be used to visualize gas-liquid two-phase flows, gas-solid two-phase flows, liquid-solid two-phase flows, and gas-liquid-solid three-phase flows. Massless scalar particles are often used for these analyses.
Different methods can be used for particle simulation analyses. These include the Discrete Element Method (DEM), the Smoothed Particle Hydrodynamics (SPH) method, the Moving Particle Simulation (MPS) method, and others. DEM is appropriate for simulating a powder flow such as earth and sand. SPH and MPS can be used for a fluid simulation analysis. The particle tracking method discussed in this article is the Particle Source in Cell method (PSI-Cell).
The PSI-Cell method was presented in 1977 in the scientific paper The Particle-Source-In Cell Model for Gas-Droplet Flows by Professor Crowe (U.S.), a prominent researcher in fluid dynamics. Figure 1 shows how a fluid is expressed and analyzed as a continuous phase by using grid-patterned elements (Euler method). Particles are tracked individually as dispersed phases (Lagrange method). Then, the fluid and the particles are analyzed interactively. A coupled analysis in which a fluid and particles affect each other is called two-way coupling. In contrast, one way coupling is where the fluid affects the particles but the particles do not affect the fluid.
Figure 1: Two-way coupling
Since the particles are considered point masses in the particle tracking method, this method should not be used for an analysis where the contact, or collision, of particles is the dominant phenomenon. (If this method is used, its accuracy will depend on the extent of the particle contact and collisions.)
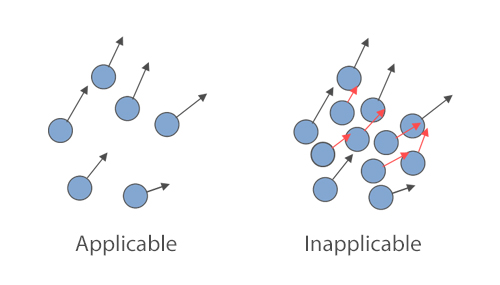
Figure 2: Application of the particle tracking method
As can be seen in Figure 3, various forces act on a particle in a fluid. When the particle density is greater than that of the fluid, the drag force and gravity are the main forces which act on the particle. For the particle tracking method, the drag force on the particle is calculated assuming the shape of the particle is a sphere. However, the shape of sand or dust found in nature is usually not a sphere.
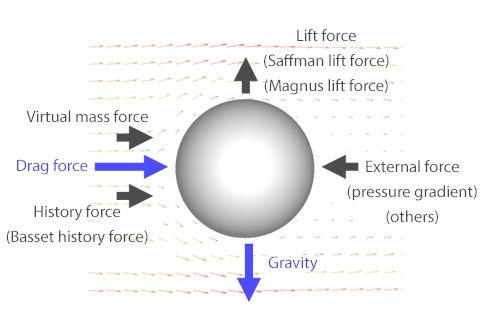
Figure 3: Forces which act on a particle in a fluid
An analysis example can be used as an illustration. A sand separator, used to separate sand from river water, groundwater, well water, or hot springs, is analyzed using the particle tracking method.
A sand separator separates sand from water using centrifugal force. This is the same principle used for a cyclone separator. However, separating sand from water is much more difficult than separating particles from air because the density difference between water and sand is approximately 2.5, which is much smaller than that between air and sand.
The sand separator is shown in Figure 4:
- Height: 900 mm
- Maximum diameter: 200 mm
- Diameter of inlet for raw water: 30 mm
- Diameter of outlet for treated water: 60 mm
The inflow rate of raw water is fixed at 2.8 m3/h. Approximately 3% of the water flows out the drain. Next, 100 sand particles with a fixed diameter and a density of 2,500 kg/m3 are injected into the inlet with the raw water every 0.1 seconds. The separation state is analyzed using the particle tracking method for 30 seconds. The sand removal rate is calculated by dividing the number of sand particles going out the drain by the total number of particles going out the drain plus the number in the treated water.
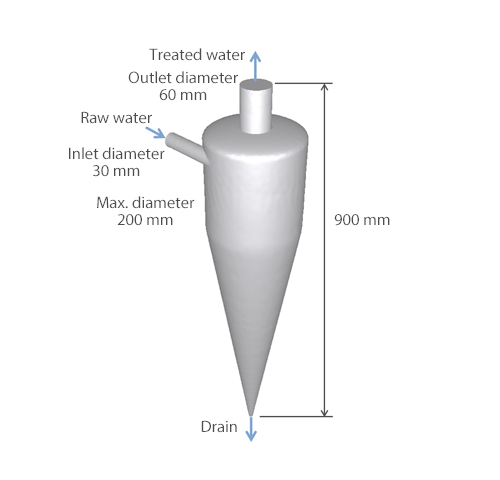
Figure 4: Sand separator
Figure 5 shows the analysis result of the behavior of sand particles with a diameter of 100 μm. The behavior of the particles is shown using velocity vectors until 7 seconds after the analysis starts. The particles flow in with the raw water, move downward along the separator wall, and flow out with the drain. The behavior is well simulated. In Figure 6, streamlines of the water are expressed with arrows. The swirl flow occurring in the separator is clearly simulated.
Figure 5: Particle behavior
Figure 6: Streamlines
Figure 7 shows the variation of the sand removal rate depending on the particle diameter, for 5, 25, 50, 75, and 100 μm diameters. The smaller the particle diameter, the lower the removal rate. In reality, a sand particle diameter is larger than 100 μm. Therefore, the design of this separator will work well for sand.
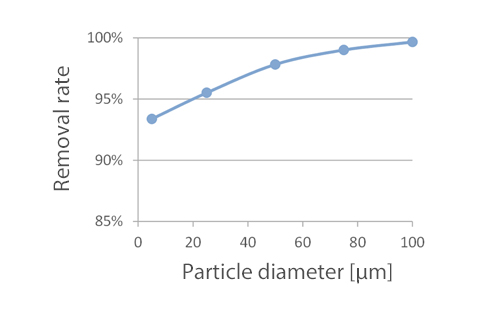
Figure 7: Variation of the sand removal rate depending on the particle diameter
The next column will explain the setting conditions for Particle Tracking Method in detail.

About the Author
Katsutaka Okamori | Born in October 1966, Tokyo, Japan
He attained a master’s degree in Applied Chemistry from Keio University. As a certified Grade 1 engineer (JSME certification) specializing in multi-phase flow evaluation, Okamori contributed to CFD program development while at Nippon Sanso (currently TAIYO NIPPON SANSO CORPORATION). He also has experience providing technical sales support for commercial software, and technical CFD support for product design and development groups at major manufacturing firms. Okamori now works as a sales engineer at Software Cradle.

