
Master Course for Fluid Simulation Analysis of Multi-phase Flows by Oka-san: 9. Particle tracking analysis III
Particle tracking analysis III
This section explains particle evaporation and volatilization of using the Particle Tracking Method.
In the 1990s, excess CO2 emission was a major environmental issue. Improving the combustion efficiency of industrial furnaces, large contributors of CO2 emission to the atmosphere, was an important initiative for both industry and academia. One of the advances from this initiative came from fluid simulation analyses that began using the particle tracking method to model particle evaporation and volatilization in spray combustion furnaces.
Particles that evaporate and volatilize are called “reactant particles”. The evaporation and volatilization of reactant particles must be modeled in stages. Figure 1 depicts evaporation of a water droplet. Figure 2 shows volatilization of a fuel droplet. In both cases, additional components are generated during the evaporation and volatilization processes. Therefore, a chemical species must be treated as a variable in an analysis of a gas-phase fluid.
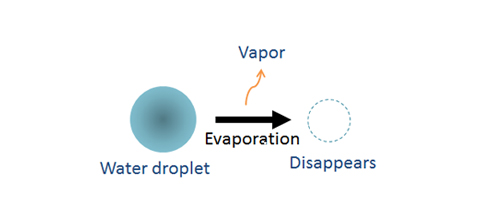
Figure 1: Evaporation model of a water droplet
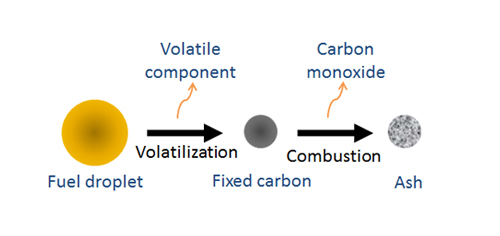
Figure 2: Volatilization model of a fuel droplet
This section will discuss the setting of spray conditions. Since the number of particles in a spray is very large, parcel approximation, described in the previous column, must be used. In addition, the particle size distribution is a necessary input. A uniform distribution can be used; however, more sophisticated distribution functions such as the Rosin-Rammler (circa 1933) or Nukiyama-Tanazawa (circa 1939) are recommended. The Sauter Mean Diameter (often referred to as SMD or d32) is recommended for expressing the average particle. The Sauter Mean Diameter considers the particle surface area in its calculation which is a critical parameter for evaporation and volatilization. In addition, parameters such as spray flow rate, spray velocity, spray pattern, and spray angle must be specified. (Figure 3 shows spray patterns and spray angle.)
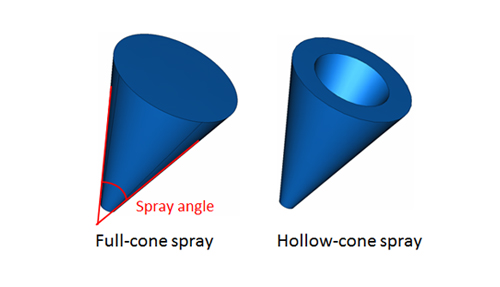
Figure 3: Spray patterns and spray angle
An analysis example will show how to model a spray. An air-assisted spray nozzle of water droplets is used to cool hot gases. The particle tracking method is used to model the spray (Figure 4). A 500° C gas flows into a container having inlet and outlet pipes. The air-assisted spray nozzle for the water droplets is mounted at the center of the inlet pipe. The air spray temperature is 27° C. A 2D axisymmetric model is used since the container and the nozzle have axial symmetry. The velocity of the hot gas in the inlet pipe is 25 m/s, and the air spray velocity is 40 m/s. Stationary wall and adiabatic conditions are applied to the entire wall surface.
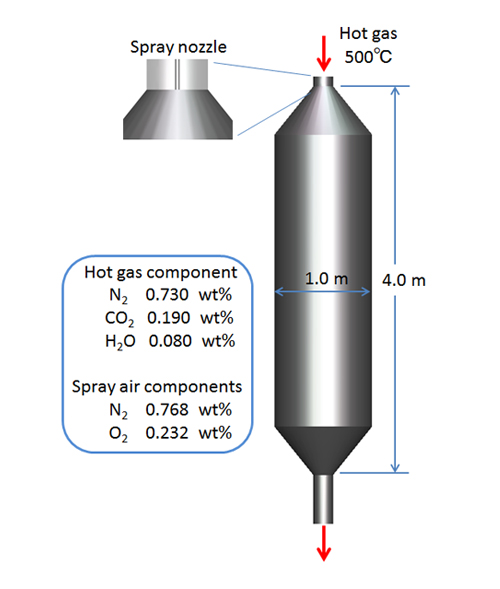
Figure 4: Spray air nozzle
The Sauter mean diameter of the water droplets sprayed from the nozzle is 20 μm and Nukiyama-Tanazawa distribution function is used to calculate the particle size distribution. The spray flow rate is 0.05 kg/s (Parcel approximation: 100,000 s-1) and the spray velocity is 15 m/s. Both a full-cone spray and a hollow-cone spray are analyzed. The full-cone spray and the hollow-cone spray angles are set to 20° and 110-120° , respectively. To keep the calculation stable, only the hot gas and the air-assisted spray air flow into the container for the first second of the calculation. Water droplets are introduced after 1 second. Figure 5 shows the droplet distribution in the container up to 0.1 seconds after the water spray starts. The droplets move in a straight direction due to the air-assisted spray air, and the hollow-cone spray width is wider near the nozzle than that of the full-cone spray.
Figure 5: Droplet distribution in the container up to 0.1 seconds after the spray starts
Figure 6 shows the analysis result for the full-cone spray model up to 12 seconds. The water droplets evaporate and cool the hot gas. Figure 7 shows the analysis result for the hollow-cone spray model. Figure 8 shows the variation of the mean temperature of the hot gas in the outlet pipe. There is no significant difference between the two spray nozzles.
Figure 6: Analysis result of the full-cone model up to 12 seconds after the analysis starts
Figure 7: Analysis result of the hollow-cone model up to 12 seconds after the analysis starts
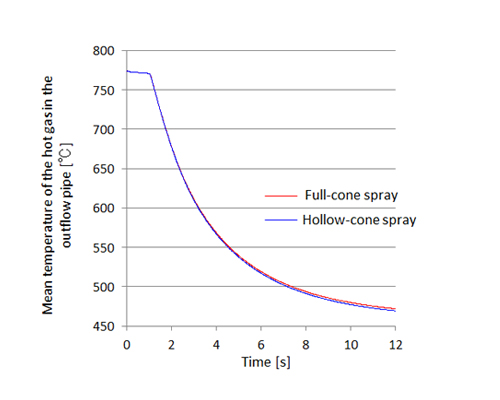
Figure 8: Variation of mean temperature of the hot gas in the outlet pipe
The next column will explain the generation of chemical species related to the evaporation and volatilization of reactant particles.

About the Author
Katsutaka Okamori | Born in October 1966, Tokyo, Japan
He attained a master’s degree in Applied Chemistry from Keio University. As a certified Grade 1 engineer (JSME certification) specializing in multi-phase flow evaluation, Okamori contributed to CFD program development while at Nippon Sanso (currently TAIYO NIPPON SANSO CORPORATION). He also has experience providing technical sales support for commercial software, and technical CFD support for product design and development groups at major manufacturing firms. Okamori now works as a sales engineer at Software Cradle.

