
National Defense Academy of Japan
Combining Tests and CFD Analysis to Solve Long Standing Issues
The configuration of cooling fans inside electronic devices is complex. This frequently results in generating large amounts of data when trying to represent the configuration accurately for fluid analysis calculations. To deal with this, engineers use the concept of the pressure-flow-rate (PQ) characteristics to simplify the calculation, although it has been pointed out that this simplification often becomes the source of errors. Professor Hajime Nakamura, from the National Defense Academy of Japan, has been exploring these issues pertaining to fan models for electronic devices and has discovered a more accurate model.
Professor Hajime Nakamura, National Defense Academy of Japan, Mechanical Engineering Dept.
Professor Nakamura is an expert in Heat Transfer Engineering, which investigates how materials can be effectively heated and cooled. Fluid flow plays a significant role in heat transfer; for example, air can be induced to dissipate heat from the silicon chips inside electronic products. The problem is, air-flow is extremely complicated, often generating small eddies and unpredictable turbulence. Professor Nakamura, whose research specializes in investigating fluid flows, explains; “CFD software can now be used for more diverse fields compared to before, but still, there are uncertainties to the analysis. My objective is to clarify the mechanisms of such phenomena that cannot easily be analyzed, by undertaking actual tests.”
Professor Nakamura started investigating fan models when the RC 181 Research Project was founded under the Japan Society of Mechanical Engineers. He learned about the issues associated with fan models for the first time at the RC 181 meeting. As high-density packaging techniques were common at the time, engineers wanted to use CFD software to evaluate how to best allocate the device parts to dissipate heat. When applying a fan to dissipate heat from an electronic device, the engineers usually ignored the detailed configuration of impeller and its rotation by using simplified fan models for CFD analysis, and specifying approximate PQ characteristics to determine the flow rate based on the pressure difference of upstream and downstream of a fan. However, some engineers have repeatedly pointed out that analysis results were often inaccurate, even when PQ characteristic values provided by manufacturers were used. The challenge was clear – they needed an accurate fan model for highly accurate CFD analysis. This motivated Professor Nakamura, who had previously been studying forced convection, to address this issue.
Identifying the Cause of Errors by Thorough Testing
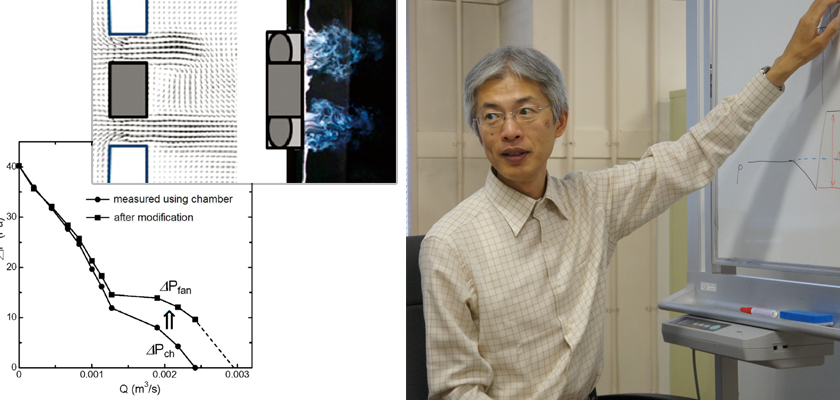
Professor Nakamura started by using the benchmarking model provided by RC 181 to carry out tests. One of the reasons for the inaccuracy was thought to be the varying definitions of pressure difference used by the fan manufacturers and the CFD software developers. However, no proof existed at that time to validate the theory. Pressure values were measured far away from the fans by the fan manufacturers, whereas CFD software calculated the fan pressure difference using values measured just upstream and downstream of fans. Professor Nakamura suspected that investigating the surrounding area of the fan would lead to the solution, and closely examined the velocity and pressure near the fan.
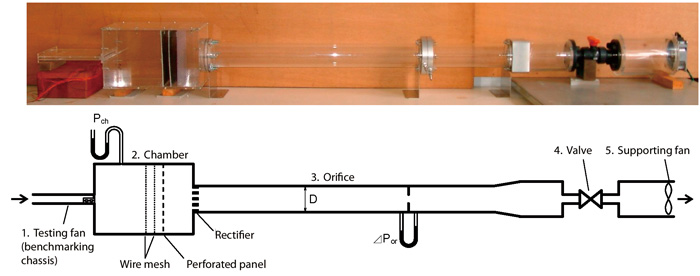
Figure 1: Simplified diagram and actual picture of an experimental apparatus.
Another problem was the measurement standard used for fan performance. At that time, only a few standards existed, such as ISO 5801 and JIS B 8330 for large to mid-scale industrial fans. But such standards did not exist for small fans used in miniaturized electronic devices. Followed by the establishment of JBMS-72-2003 (Acoustics — Method for the measurement of airborne noise emitted by micro-fan) in 2003 that standardized measurement methods for smaller fans with lower air-flows, Professor Nakamura designed an apparatus to inspect fan performance according to the standard. The apparatus was about 3m in length, and enabled engineers to measure the capability of smaller fans without separating them from their chassis (Figure 1). This encouraged engineers to measure PQ characteristics on their own and actively undertake further tests.
Over a number of evaluations, Professor Nakamura became aware of three major problems that needed to be solved. First, the definitions of pressure employed by the fan manufacturer and the CFD software developer differed. Second, as the packaging density increased, the variation in the PQ characteristic values also increased. Third, the velocity distribution of the air-flow generated by the fans could not be predicted from the PQ characteristics. In search of CFD software that could be used to solve these problems, Professor Nakamura came to Cradle software. He started using SC/Tetra in 2007 to compare the results from fan tests and CFD analysis.
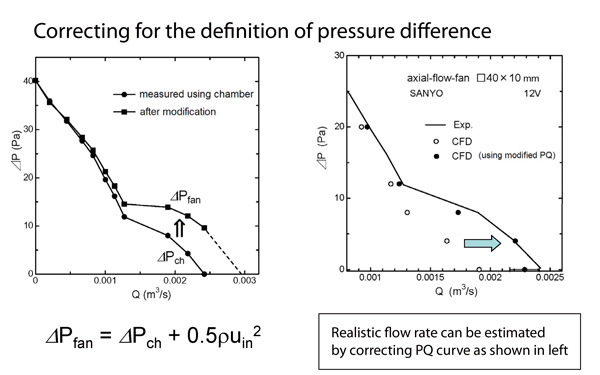
Figure 2: Dynamic pressure correction on PQ curve of fan model.
SC/Tetra to Adjust PQ Characteristics
Professor Nakamura explains that the first problem was solved quickly soon after introducing SC/Tetra. As the air-flow contraction occurs at upstream of a fan, the velocity increases and the pressure decreases. Yet, manufacturers did not count for this pressure drop because they used a chamber system to measure the pressure far upstream of the fan. In comparison, the downstream pressure is almost the same wherever it is measured.
In short, the difference between the fan measurements and fan models arose from the pressure drop near the air supply. Professor Nakamura thought that adding the dynamic pressure generated by the accelerating flow near the air supply to the PQ curve would properly adjust the values. For example, when ρ is the density of the air and u is the average velocity of the air supply, the dynamic pressure can be expressed as 1/2 ρu2. When Q is the flow rate, and A is the cross-sectional area of the flow path, the air velocity, u, can be derived from Q/A, which is known from the PQ curve and the fan configuration. Professor Nakamura applied the dynamic pressure to the fan model PQ table of SC/Tetra and found that the generated values matched to the experimental results (Figure 2). “This correction made it easier for engineers to make the necessary adjustments when working with fans,” says Professor Nakamura. He also noted that he frequently introduces this example at seminars and academic conferences to explain the research results, and is often amazed at the number of questions and amount of interest from the audience.
Verifying the Best Definition of Rotational Component
The next concern was the unpredictable velocity distribution. Ideally the air from the fan would be defined with two components, axial velocity and tangential velocity. Unfortunately, only the flow rate is known from the PQ curve and not the rotational component. Until recently engineers using CFD applied different coeffcients to account for the rotational velocity component. Swirl ratio, defined by the rotational and axial velocity, was commonly used. The ratio of angular velocity and impeller rotational velocity was also used in older versions of Cradle’s software. Determining the proper value for the rotational component is a complicated task; it requires significant engineering experience and insight. Whether such approaches are truly appropriate for accurately representing the actual phenomena is still not fully verified.
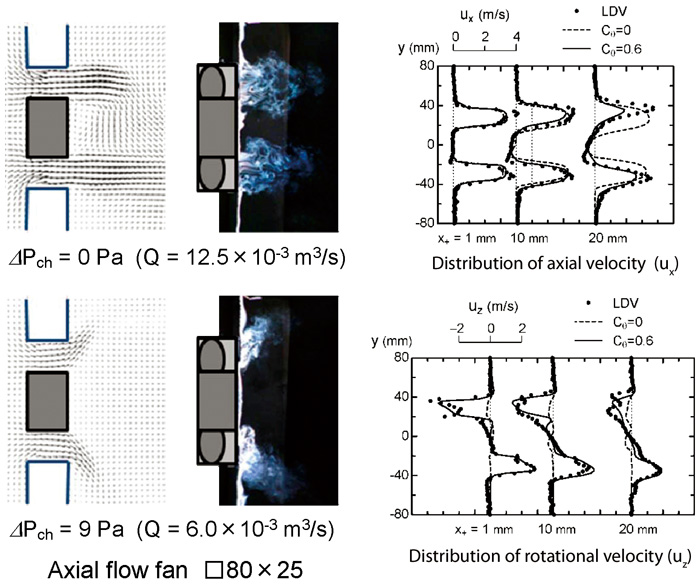
Figure 3: Comparison between experimental test and analysis results of rotational fan model (from left: analysis results of fan model, smoke-wire visualization, comparison of velocity distributions).
Professor Nakamura started to consider applying a model, which calculates rotational components using the number of vanes, number of rotations, inner radius, outer radius, and thickness of a vane. He based his theory on the concept of drag coefficient (CD). The drag coefficient varies depending on the model shape and follows the law of similarity. For example, the drag coefficient of any disk normal to the flow is roughly 1.2, which remains constant unless the disk is extremely small. Professor Nakamura thought that this idea could be applied to rotating vanes, regardless of their size and velocity. He calculated the rotational force coefficient as CΘ using the rotational force expressed as FΘ=1/2ρuΘ2ACΘ. He found that a constant CΘ of 0.6 gave analysis results that best matched experimental test results (shown in Figure 3), and worked for both large and small fans. Professor Nakamura also found that for the smallest fan of □17mm tested, the optimum value of CΘ was somewhat higher although the differences of the results were still relatively small compared to using CΘ=0.6.
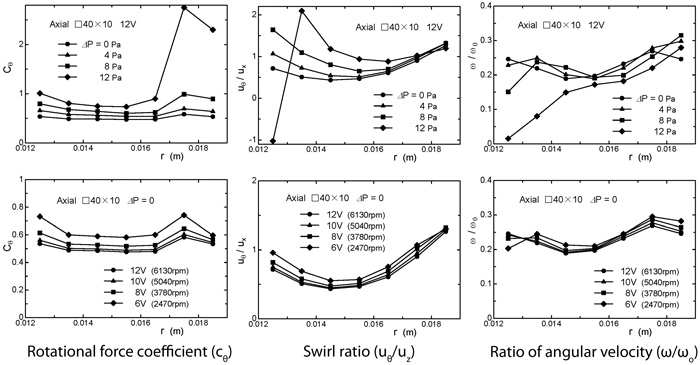
Figure 4: Changes by radial positions of rotational force coefficient, swirl ratio, and ratio of angular velocity (validated by the detailed analyses where influence of impeller configuration and its rotation was taken into consideration)
Determining the rotational component of the velocity had always been a challenge for Professor Nakamura as he had not yet been able to identify the best model for this calculation. To overcome the challenge, he started using rotational force coefficients as an alternative to applying the drag coefficient. He was concerned whether the idea of force coefficient should be applied to rotating vanes because drag coefficients are normally used for modeling a cylinder or sphere in a uniform flow. Yet the results when using Cθ were convincing. Professor Nakamura has also evaluated swirl ratio and the ratio of angular velocity to rotational velocity, and found that using Cθ works better as a constant value from the center to outside of the vane (Figure 4). Based on the investigations, he named Cθ the non-dimensional swirl coefficient, which is now used in the Software Cradle fan model. As a result, engineers can directly reap the benefits of Professor Nakamura’s fan research when they use Cradle software.
Analyzing a Highly Packed Device
Professor Nakamura’s last concern was that the change in the PQ curve becomes significant when the device was more densely-packed. To find a solution he examined the application of the revised fan model. When blockages got close to a fan, the PQ curve changed as the blockages restricted the fluid flow. This was caused by the additional pressure loss solely due to the presence of obstacles. Namely, the fan performance itself did not change by the obstruction. The only time that analysis and test results did not match was when obstacles were too close to the upstream side of the fan. In this case, the flow's entrance angle altered, which deteriorated the fan performance. As long as this condition is not reached, Professor Nakamura’s model can be used to represent fluid flow.
Further Investigation Using Axial Fans
“I hope to investigate different kinds of fan going forward,” says Professor Nakamura. This includes a fan with one rotor with a non-rotating deflector just downstream of the rotor, and a type with two counter-rotating rotors in a series. He suspects that the revised fan model can be used to analyze a fan with the deflectors. “I think the major issues with fan models have mostly been solved. I’m expecting that manufacturers will continue to develop more capable fan designs, but my basic fan model will be sufficient, as long as we review the coefficient each time,” he says.
Professor Nakamura’s next challenge beyond optimizing fan models is the modeling of heat transfer. His research interest includes investigating heat transfer with fluid flows, which he believes can be analyzed accurately using CFD software when the flow is laminar. It becomes more difficult to accurately simulate when the flow becomes turbulent. In this case, the flow and temperature fluctuate in complicated manner, which directly impact the temperature fluctuation in the solid. Professor Nakamura hopes his work can lead to improved heat transfer modeling between the fluid and solid for turbulent flows.
CFD Analysis as a Necessary Tool to Verify Tests
Just as Professor Nakamura’s research has always done, he will continue to explore and verify phenomena through experimental tests that challenges the capabilities of traditional CFD analysis. This does not mean that Professor Nakamura is against CFD analysis; in fact, he considers CFD a necessary tool to verify tests. He recommends combining CFD analysis with actual tests. This is what he did with the fan model, and adopting this approach will help convince other engineers to experiment. Regarding Cradle’s software, Professor Nakamura says “I have great faith in their software. I’m also reassured by how quickly they implemented the research results into their software.” In particular, many engineers found that the software’s capability to adjust the dynamic pressure was useful. “Their feedback helps our research continue to make progress. This, in turn, can lead to new investigations, which is the pathway to new possibilities,” says Professor Nakamura.
Professor Hajime Nakamura, National Defense Academy of Japan
Mechanical Engineering Dept., Thermal Engineering Laboratory
- Research interests: Thermal Engineering, Fluid Engineering
- Education: Graduated Mechanical Science and Engineering from Tokyo Institute of Technology, and attained M.S. and Ph.D. degrees in Energy Science from Tokyo Institute of Technology
- Doctorate: Ph.D. in Engineering
*All product and service names mentioned are registered trademarks or trademarks of their respective companies.
*Contents and specifications of products are as of June 1, 2013 and subject to change without notice. We shall not be held liable for any errors in figures and pictures, or any typographical errors.
Download

