
Development of the Cavitating Flow Analysis Function
Keita Fujiyama (Software Cradle, Software Engineering Dept.)
Development of the Cavitating Flow Analysis Function
Using the SC/Tetra cavitating flow analysis function helps design engineers accurately predict possible cavitation issues while designing fluid machinery. Cavitation is a highly unsteady phenomenon that can cause many problems. These include device disorientation, aerodynamic noise, and surface erosion. Performing transient cavitating flow analyses early in the design process and implementing appropriate countermeasures are critical for achieving equipment performance and durability. Keita Fujiyama from Software Cradle, Software Engineering Department, explains the background and development of the cavitating flow analysis function.
Keita Fujiyama, Software Cradle, Software Engineering Dept
When is a cavitating flow analysis useful?
Cavitation often occurs on machines that are driven by liquid motions. Some equipment, such as an ultrasonic eyeglass cleaner, are effective because cavitation is a positive attribute. However, in most cases, cavitation is a negative attribute. Machinery such as pumps, marine propellers, and power plant pipes degrade in performance or vibrate unnecessarily due to cavitation.
Due to increasing demand for device miniaturization and high performance, a major challenge faced by designers of hydraulic turbine products such as pumps and marine propellers, has been to continually improve efficiency. While CFD has been used to predict machine performance, the demand for better efficiency requires engineers to predict and understand even more detailed phenomena such as when and how cavitation occurs. Since cavitation can impair performance, cause physical damage, and create noise, design engineers must identify the risks and develop solutions to avoid them prior to production.
Physically simulating cavitation bubbles in the size of few microns is not easy. In addition, simulating the highly complex transient flows would be extremely challenging. Considering these issues, one simulation approach is to model the cavitation phenomenon using caviation models. Cavitation models have progressed substantially over the last several years assisted by hardware and software advancements. Calculations are fast and highly accurate. This has enabled design engineers to use the analytical results to develop design solutions.
Describe the method used for cavitating flow analyses in SC/Tetra
Essentially, the cavitation function in SC/Tetra is the combination of the following models; a homogeneous model of two phase gas-liquid media*1 and a full cavitation model*2. The homogeneous model is used for flowing fluids. The model assumes that the equation of state for the liquid phase is analogous to that of the vapor phase. It combines the fluid density of the vapor, liquid, and non-condensable gas based on each density and mass fraction, and performs calculations as a single compressible fluid analysis.
When analyzing bubble generation and disappearance, a full cavitation model is used. The cavitation model was proposed by Singhal et al. and accounts for bubble generation and collapse based on bubble dynamics, turbulence effects, and non-condensable gas that includes air.
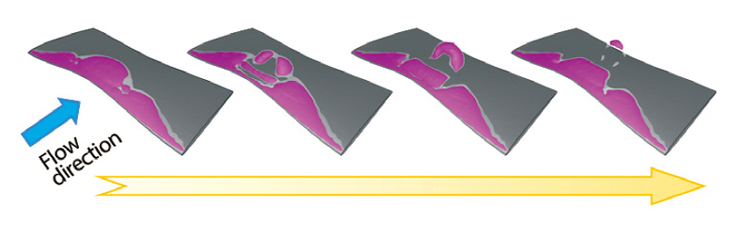
Fig 1 Predicting the occurrence of transient cavitation around the three-dimensionally twisted turbine under water
(red area indicates the predicted cavitation)
Since cavitation is a highly transient phenomenon, the commonly used RANS (Reynolds-Averaged Navier–Stokes equations) model is not really appropriate. A better approach is to use a hybrid RANS and LES (Large Eddy Simulation) model with relatively high spatial and time tolerance. This is often used as a general engineering model and can be more suitable. Fig 1 shows a Software Cradle analysis example*3 that analyzed periodical shedding of cavitation. Intermittent shedding could not be replicated using the RANS model, whereas applying the SST-SAS (Shear Stress Transport-Scale Adaptive Simulation) hybrid model, produced a more accurate simulation.
Predicting the occurrence of cavitation has become analytically more feasible, but predicting the extent of cavitation areas and how it changes its states are still great challenges. Our continuous challenge is to develop and verify the cavitation function for the inputs provided by both the cavitation and turbulence models.
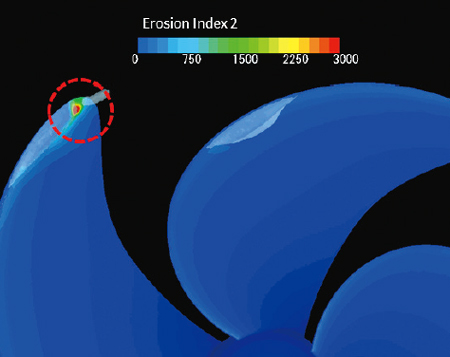
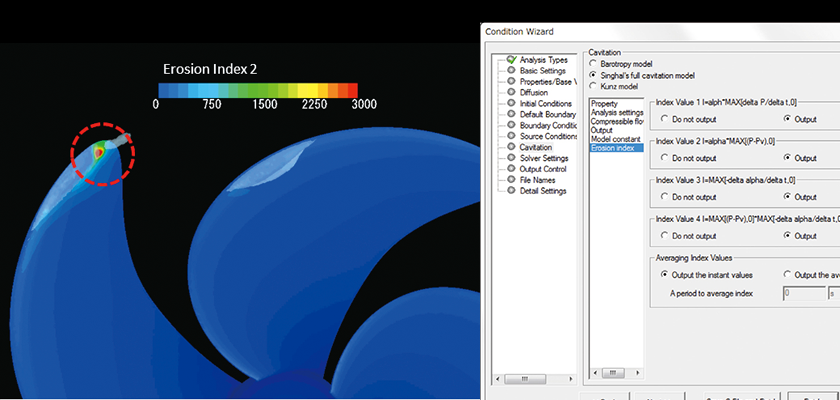
Fig 2 Analysis example of erosion (output result of index 2)
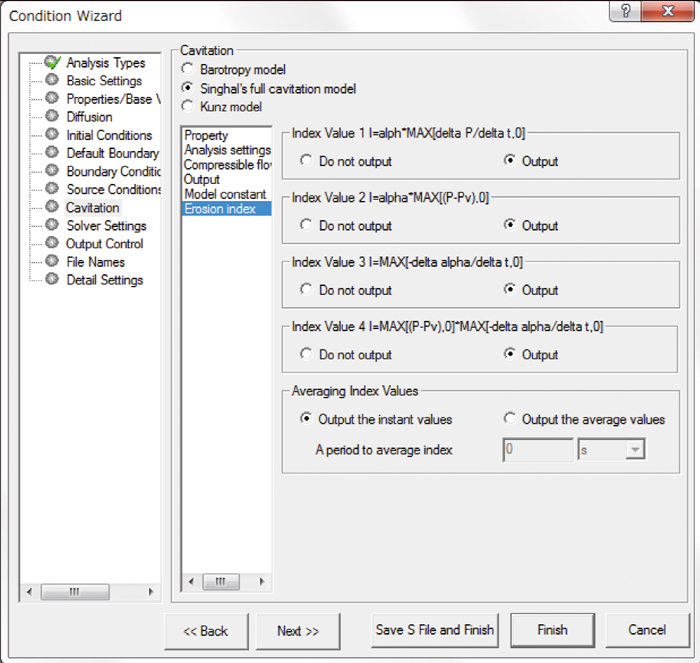
Fig 3 Output setting window of simplified index
Erosion is often closely linked to cavitation. Is it possible to consider the effect in simulations?
Erosion refers to the phenomena, where micro-jet and shock waves generated by the rapture of bubbles damage the surfaces of the physical object. It likely occurs when the pressure rises rapidly as the bubbles collapse.
Predicting erosion, and considering the phenomena at the micro level is unrealistic using current technology. With SC/Tetra, a simplified index for erosion risks as proposed by Nohmi et al.*4 can be displayed on the target surface. This index is based on the combination of absolute values and variances of pressure and vapor volume.
The erosion risk index is a simplified parameter since detailed prediction, such as estimating the volume of erosion, is not possible. Despite this limitation, the index allows engineers to evaluate possible locations where erosion may occur and assess the risks. This can lead to the development of erosion-free equipment.
The demand for cavitation analysis capabilities in marine applications is growing?
Yes. Transient cavitation occurs on propeller due to the ship wake. This can cause substantial pressure fluctuations on the vessel. Knowing the extent of cavitation and how the resultant pressure fluctuations will affect the ship structure and passenger comfort during the design phase of the vessel is imperative. But conducting experiments that account for the ship body and propellers is costly and time consuming. This is why CFD offers so much potential for this particular field.
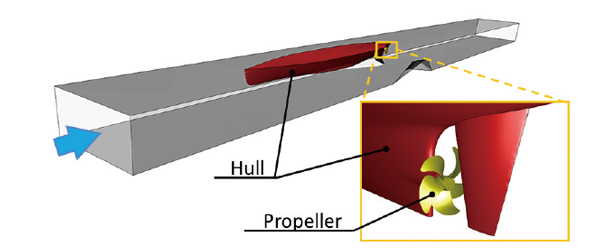
Fig 4 Analysis model of marine propeller
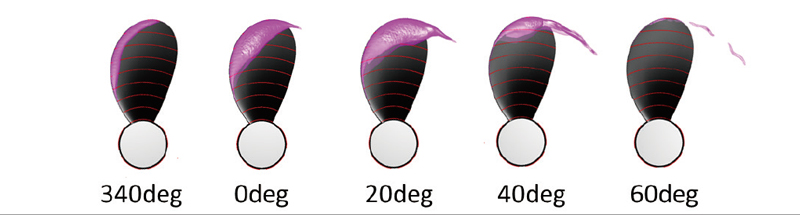
Fig 5 Predicting the occurrence of transient cavitation on propeller turbine surfaces
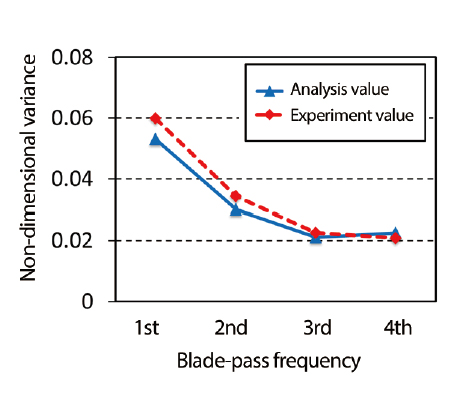
Fig 6 Pressure fluctuation on the surface of the ship
Now, let us examine the analysis example*5 where flows around the ship and propeller are simulated together in a single model (Fig 4). We selected an analysis field according to the conditions used in experiments. Analysis models were generated based on the ship body and propellers used in scale models.
For validation, we estimated the cavitation patterns. Fig 5 indicates the area where cavitation occurs (isosurface with 10% void fraction). The calculated transient changes in cavitation caused by the ship wake followed the same pattern as the results from the experiments. Fig 6 shows the comparison between the amplitude of pressure fluctuations on the ship body for CFD and the experimental results. As the CFD results indicate, the amplitude of the pressure variation can be predicted not only for the blade passing frequency but also for its higher harmonic frequencies. I believe this shows that fluid analysis can be highly effective for estimating cavitation and/or pressure fluctuations during the design phase.
How many mesh elements are required?
The maximum number of mesh elements used in CFD analyses used to be only a few million. But as software and hardware capabilities have improved, accurate and efficient analyses can be performed using approximately one hundred million mesh elements. Fig 7 illustrates the cavitation that occurs within the eddy near the marine propeller edge*6. The left turbine in Fig 7 shows long cavitation extending from the turbine edge. To perform this analysis, 75 million mesh elements were used. The mesh adaptation function in SC/Tetra was used to refine mesh elements around the eddy near the blade edge.
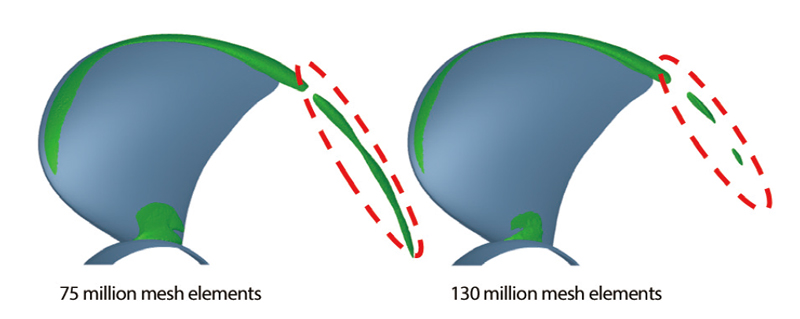
Fig 7 Predicting cavitation occurring within the eddy near the turbine edge
The blade on the right side in Fig 7 shows the cavitation predicted when using 130 million mesh elements. The mesh adaptation analysis function was not used, and the cavitation occurring within the eddy near blade edge was not predicted. In conclusion, the accuracy of cavitation analysis is dependent not only on the number of mesh elements used, but also on how adequate the mesh is for the specific phenomenon.
How is an analysis set up?
A cavitation analysis is set up in two steps. First, create an initial flow field by performing an incompressible analysis without cavitation. Using these results, restart as a compressible transient cavitation analysis.
The analysis becomes unstable when the pressure is extremely low or amount of cavitation is large. Any customers having convergence problems with cavitation analysis should contact the Software Cradle technical support team, as we have expertiese with substantial experience working with cavitation analyses. The support engineers can answer questions and provide specific advice.
What are the benefits of using SC/Tetra and are there any special considerations to keep in mind?
Setting appropriate condition and generating a sufficiently large and high quality mesh are required as in any CFD analysis. It is also important to validate the CFD calculations against experiment results. I think it is still too early to declare that CFD analyses can completely replace experiments.
The greatest benefit of CFD simulation is being able to visualize the occurrence of cavitation, which is difficult to actually observe experimentally. Visually observing the phenomena will enhance both learning and understanding, which will be beneficial for satisfying each customer's engineering objectives.
Certainly cavitation analyses have become easier and more effective as the analysis process is better established. Being able to authentically predict cavitation means that engineers can estimate pressure fluctuations and erosion risks. This will generate significant benefits for design engineers.
Any message to the customers?
Our goal is to provide further benefits to the customers by continuing to improve cavitation analysis capabilities. We will continue to introduce new technologies and improve the SC/Tetra cavitation analysis.
(*1)Okuda, K. and Ikohagi, T., "Numerical Simulation of Collapsing Behavior of Bubble Clouds", Trans. of the Japan Society of Mechanical Eng. B, Vol. 62, 1996
(*2)Singhal, A.K., Athavale,M.M., Li,H.Y., Jiang, Y., "Mathematical Basis and Validation of the full Cavitation model", Journal of Fluids Engineering, vol.124, 2002
(*3)Fujiyama, K., Kim, J-H., Hitomi, D., and Irie, T., "Numerical Analysis of Unsteady Cavitation Phenomena by using RANS Based Methods", Proc. of the 16th Cavitation Symposium, 2012
(*4)Nohmi, M., Iga, Y., and Ikohagi, T., "Numerical Prediction Method of Cavitation Erosion", Proc. of Turbomachinery Society of Japan,Vol.59, 2008
(*5)Fujiyama, K., "Investigation of Ship Hull Pressure Fluctuation induced by Cavitation on Propeller using Computational Fluid Dynamics", Proc. of the 17th Cavitation Symposium, 2014
(*6)Fujiyama, K., Kim, C., and Hitomi, D., "Performance and Cavitation Evaluation of Marine Propeller using Numerical Simulations", Proc. of smp'11 Workshop on Cavitation and Propeller Performance, 2011
*All product and service names mentioned are registered trademarks or trademarks of their respective companies.
*Contents and specifications of products are as of April 1, 2015 and subject to change without notice. We shall not be held liable for any errors in figures and pictures, or any typographical errors.
Download

