
Case Study – Learn about Thermo-Fluid Analyses Optimization No. 9: Optimal shape of a louver (1)
Optimal shape of a louver (1)
In many cases, a louver is used for the opening of an electric device and such to prevent droplets and dust from invading. A louver is a device, as shown in Figure. 1.1, with slats combined in parallel at a certain pitch. A large louver increases the cost and causes the decrease of ventilation flow rate. Here, let us think about the smallest shape of a louver without decreasing the ventilation flow rate as much as possible. Our products EOopti and SC/Tetra are used to explore the optimal shape of a louver.
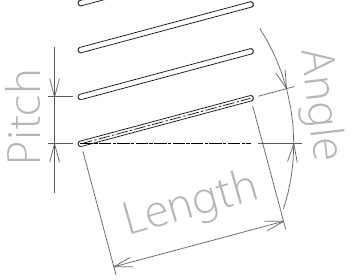
Figure 1.1 Cross section of a louver
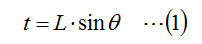
First, we can presume that droplets and dust invasions can be prevented by shielding the gaps between the louver slats seen from the horizontal direction. That is, we will consider only the state in which the edge of a slat matches the edge of the next slat, seen from the horizontal direction. In this state, equation (1) is satisfied in relation to pitch t, length L, and angle θ; therefore, a unique pitch can be determined if the length and angle are defined.
In other words, if you fix the length and the angle, the number of slats required for shielding the opening will be obtained from the formula: height of the opening/pitch. This means that the optimal solution will be the smallest pressure loss caused by the louver and the shortest length of a louver per pitch using the length and the angle of the louver as design variables. Qualitatively thinking, a large angle will shorten the louver length per pitch from equation (1), and will cut cost; however, pressure loss will increase because the angle of turn of the flow will be large. In contrast, a small angle requires a long louver length per pitch; however, pressure loss will decrease. That is, the issue is a trade-off between the louver length per pitch and pressure loss, and the optimal solution for the louver angle and length can exist.
Here, let us take an orifice as an example to explain pressure loss. An orifice is a circular plate with a hole at its center, as shown in Figure 1.2. If an orifice is placed in a pipe in which a fluid passes through, pressure difference occurs across the orifice. From this pressure difference, an orifice flowmeter measures the flow rate. Figure 1.3 shows the SC/Tetra simulation result of static pressure across the orifice with the following conditions: Orifice’s outside diameter ⌀20, orifice’s inside diameter ⌀10, air inflow 1 m/s. Static pressure is -4.5 Pa just after the orifice, and increases to approximately 0 Pa at the point approximately five times of the orifice’s outside diameter. Static pressure is low just after the orifice because dynamic pressure of the flow accelerated by the orifice acts to decrease the static pressure by Bernoulli's principle. The farther the point is from the orifice, the lower dynamic pressure is and the higher static pressure is because of the flow diffusion. Pressure loss is the difference of static pressure between a point before the orifice and a point after the orifice where pressure recovers. In this example, the pressure loss is 13 Pa. That is, to measure or analyze pressure loss, you need to prepare a flow path long enough before and after the pressure loss medium. Just as friction loss occurs because an object moves, pressure loss occurs because a fluid flows. That is, pressure loss is a result of the loss rate of dynamic pressure followed by a decrease in static pressure by Bernoulli's principle; therefore, pressure loss ΔP Pa is proportional to dynamic pressure and can be expressed as follows:
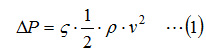
where, ζ is loss coefficient, ρ is density of the fluid [kg/m3], and v is velocity [m/s]. Pressure loss is evaluated with loss coefficient ζ, which is derived by the following equation using the pressure difference obtained from a measurement or an analysis:
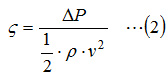
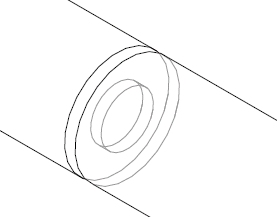
Figure 1.2 Orifice
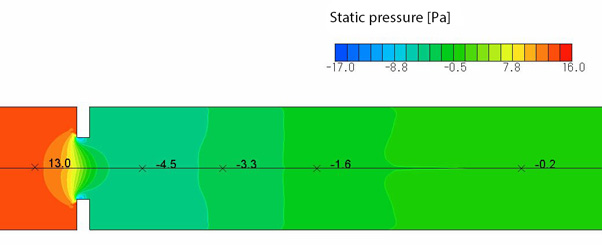
Figure 1.3 Pressure difference across the orifice
In the next column, we will create an analysis model and set conditions.
[Reference] Machine Engineering Handbook – Fluid engineering (in Japanese)
User's Guide Optimization (Option)

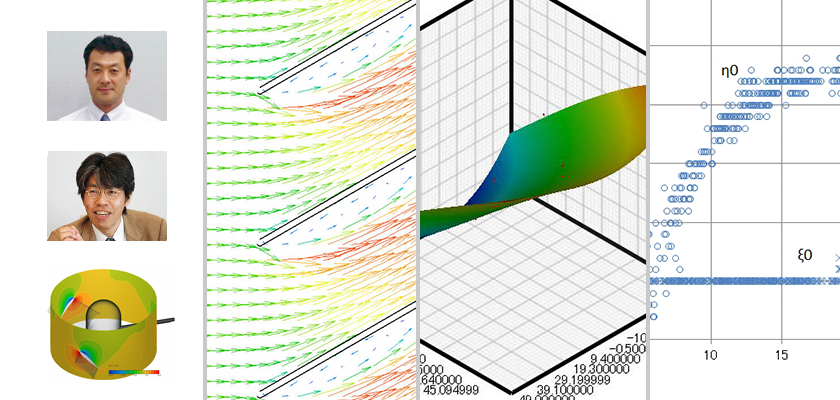
About the Author
Professor Gaku Minorikawa | Faculty of Science and Engineering,
Department of Mechanical Engineering, Hosei University
Certified environmental measurer (noise and vibration)
- 1992 Joined EBARA CORPORATION
- 1999 Became an assistant at Hosei University Faculty of Engineering
- 2001 Obtained Doctor of Engineering at Tokyo Institute of Technology
- 2004 Became Assistant Professor at Hosei University Faculty of Engineering
- 2010 Became Professor at Hosei University Faculty of Science and Engineering

About the Author
Takahiro Ito | Senior Researcher, ORIENTAL MOTOR Co., Ltd.
- 1982 Graduated University of Tsukuba (College of Engineering Sciences) and joined Nippon Steel Corporation, where he worked on the development of heating and cooling facilities.
- 1988 Joined ORIENTAL MOTOR Co., Ltd. and worked on the design and development of ventilator vanes and frames.
- 2008 Obtained Doctor of Engineering at Hosei University.
- He is Senior Researcher of ORIENTAL MOTOR Co., Ltd. (as of January 2014).

