
Case Study – Learn about Thermo-Fluid Analyses Optimization No. 8: Search for a shape with minimum fluid drag (5)
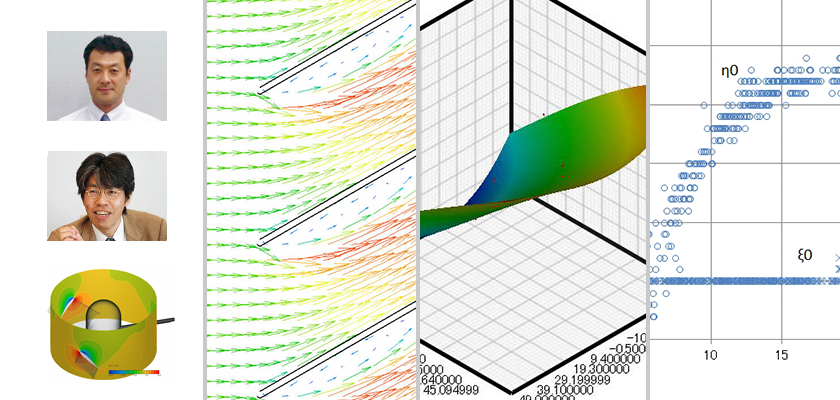
Search for a shape with minimum fluid drag (5)
In the previous column, we searched for an optimal shape with the Reynolds number 650,000. In this column, we will discuss why the optimal shapes are different depending on the Reynolds number.
There is a large difference in drag coefficient with Reynolds number 650 and 650,000. To find out why this is the case, drag coefficient of each of the proposed optimal shapes is graphed, and each graph is divided into the contributions of profile drag and friction drag (Figure 5.1).
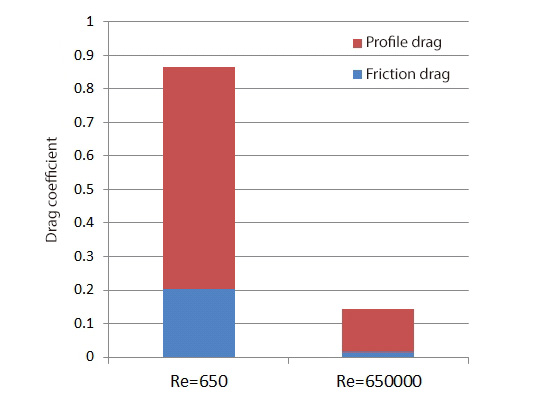
Figure5.1 Comparison of drag coefficient with Reynolds number 650 and 650000
As we can see, with the Reynolds number 650, the contribution of friction drag has a relatively large share of drag coefficient, and it alone exceeds the total value of drag coefficient with the Reynolds number 650,000. Since the Reynolds number is the ratio of inertia force to viscous force, we can presume that the viscous force or the friction drag becomes predominant and increases its contribution at a low Reynolds number. In addition, the contribution of profile drag is large at a low Reynolds number. To figure out the cause of this, lines at 99% of the mainstream velocity, i.e., velocity boundary layer, are drawn (Figure 5.2 and Figure 5.3).
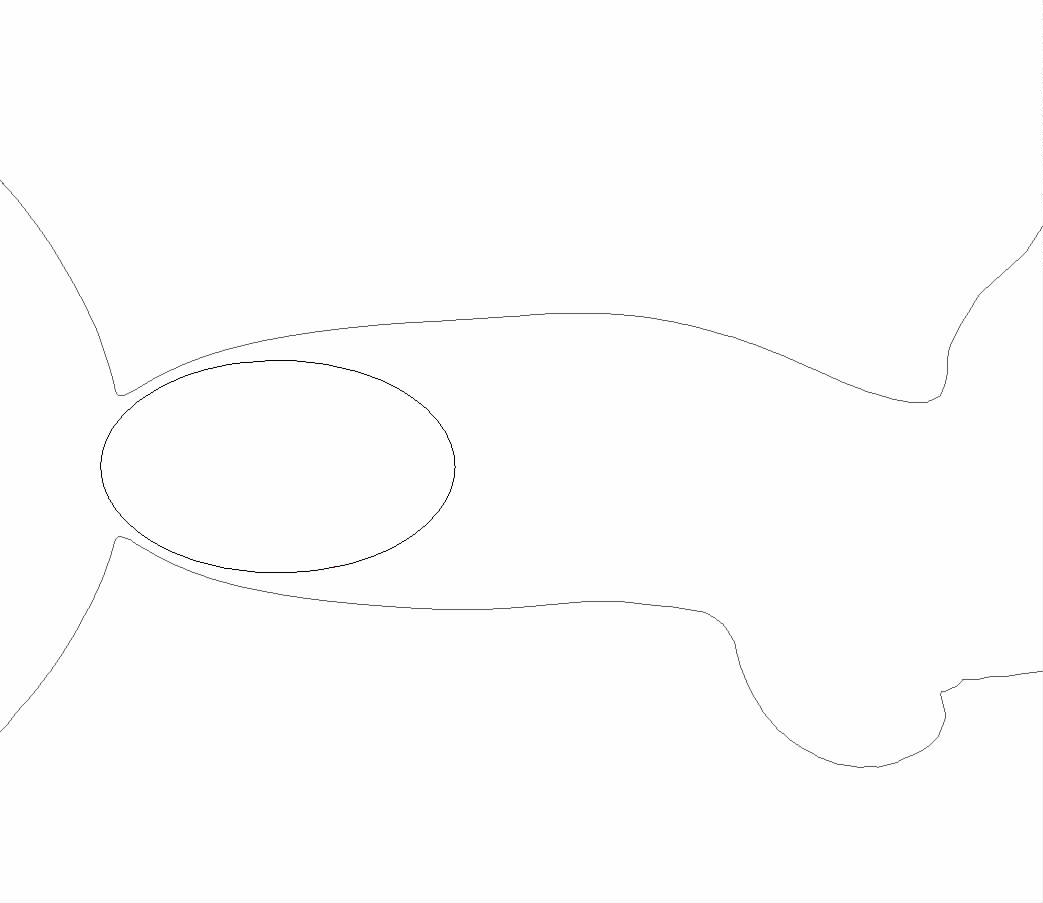
Figure5.2 Velocity boundary layer of the optimal shape with Reynolds number 650
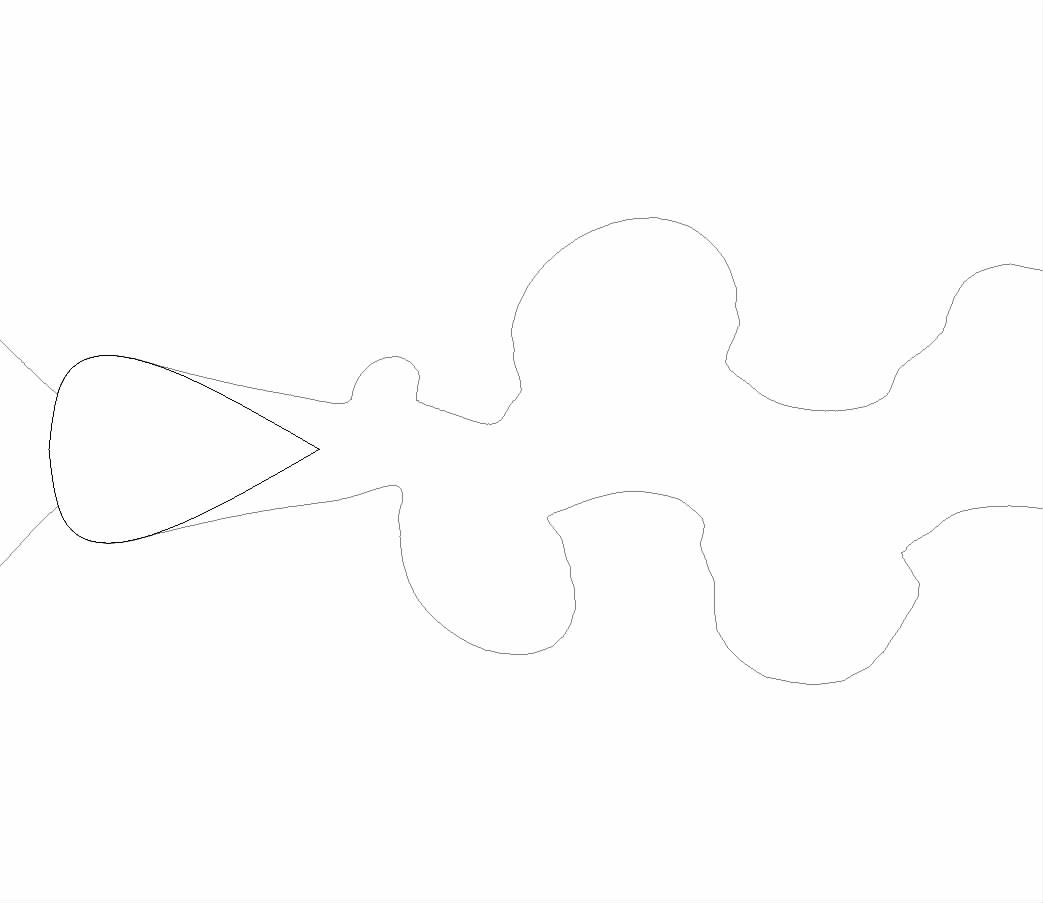
Figure5.3 Velocity boundary layer of the optimal shape with Reynolds number 650000
In Figure 5.3 showing the result with Reynolds number 650,000, the velocity boundary layer around the object stays near the surface of the object, which indicates that the shape of the object affects the flow. On the other hand, in Figure 5.2 showing the result with Reynolds number 650, the velocity boundary layer is extended to a larger area around the object. That is to say, since the velocity boundary layer with the width corresponding to the width of the object covers behind the object regardless of its shape, there is not much difference in drag coefficient between the proposed optimal and worst shapes; moreover, the large wake behind the object leads to the large profile drag.
In the next column, the results are presented for the optimization of the tilt of a louver, which is used for places such as an aperture of an electronic device.
[Reference] Kikaikougaku binran ‘Ryutai kougaku’ (Mechanical engineering handbook, ‘Fluid engineering’),
User's Guide Optimization (Option)

About the Author
Professor Gaku Minorikawa | Faculty of Science and Engineering,
Department of Mechanical Engineering, Hosei University
Certified environmental measurer (noise and vibration)
- 1992 Joined EBARA CORPORATION
- 1999 Became an assistant at Hosei University Faculty of Engineering
- 2001 Obtained Doctor of Engineering at Tokyo Institute of Technology
- 2004 Became Assistant Professor at Hosei University Faculty of Engineering
- 2010 Became Professor at Hosei University Faculty of Science and Engineering

About the Author
Takahiro Ito | Senior Researcher, ORIENTAL MOTOR Co., Ltd.
- 1982 Graduated University of Tsukuba (College of Engineering Sciences) and joined Nippon Steel Corporation, where he worked on the development of heating and cooling facilities.
- 1988 Joined ORIENTAL MOTOR Co., Ltd. and worked on the design and development of ventilator vanes and frames.
- 2008 Obtained Doctor of Engineering at Hosei University.
- He is Senior Researcher of ORIENTAL MOTOR Co., Ltd. (as of January 2014).

