
Case Study – Learn about Thermo-Fluid Analyses Optimization No. 6: Search for a shape with minimum fluid drag (3)
Search for a shape with minimum fluid drag (3)
In the previous column, the overview of condition setting and design of experiments using EOopti are described. In this column, we search for a shape with which drag force becomes the minimum with the Reynolds number 650.
Perform a CFD analysis using a model created based on a design of experiments with EOopti, and obtain a drag coefficient. Calculate cross-section area ratio and input the obtained results in EOopti as shown in Figure 3.1.
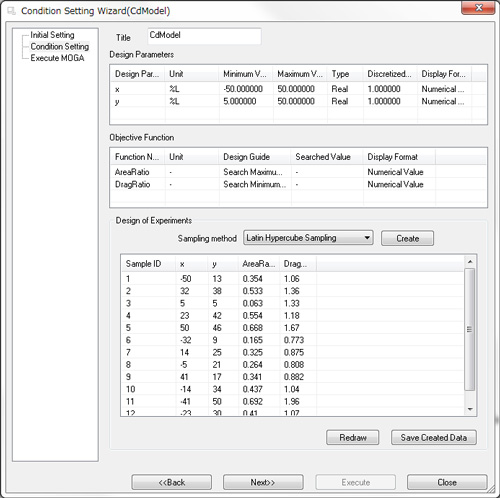
Figure 3.1: Input of analysis results in EOopti
Click Next in the dialog to perform optimization. You will obtain response surfaces and optimal solution distribution. Figure 3.2 shows the response surface of cross-section area ratio. The ratio increases almost in proportion to the Y coordinate of the intermediate point. In addition, the farther the X coordinate of the intermediate point is away from zero, the larger the cross-section area ratio is. Figure 3.3 shows the response surface of drag coefficient. As for drag coefficient, it becomes small when the X coordinate of the intermediate point is around zero and the Y coordinate is around 30. When the X coordinate of the intermediate point is the maximum and the Y coordinate is around 50, drag coefficient is the maximum. From Figure 3.2 and 3.3, you can find cross-section area ratio and drag coefficient are somewhat in the relationship of trade-off. However, they are not in the complete trade-off relationship. Thus, we can expect that there is a shape with which cross-section area ratio is large and drag force is small. Then, let us see the optimal solution distribution.
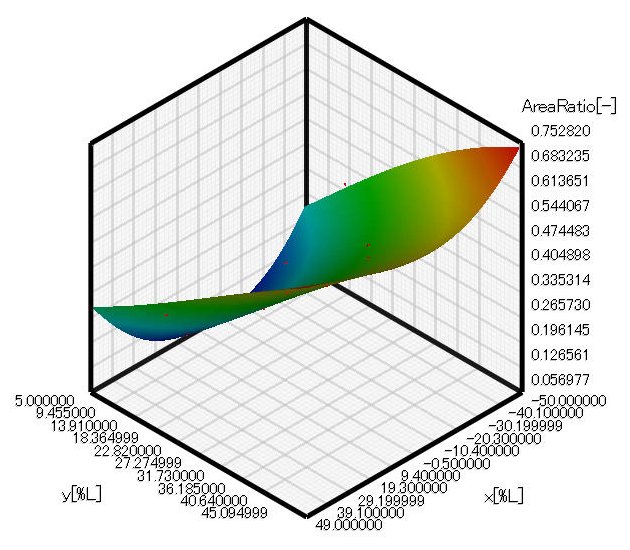
Figure 3.2: Response surface of cross-section ratio
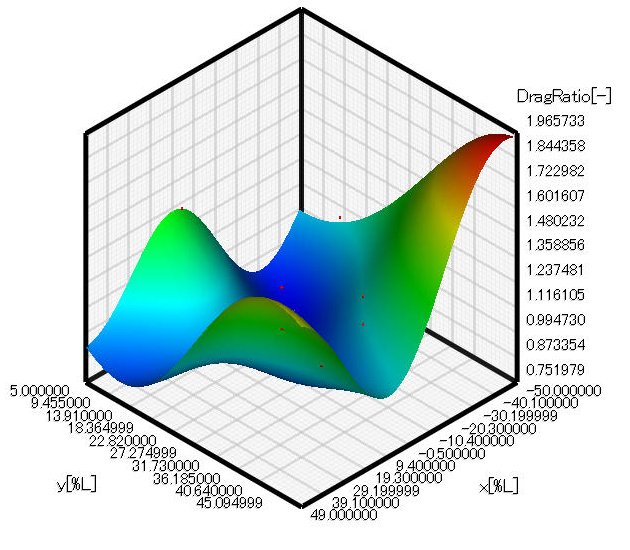
Figure 3.3: Response surface of drag coefficient
Figure 3.4 is optimal solution distribution. Cross-section area ratio is large and drag coefficient is small (optimal solution) around the lower-right corner in the figure. Blue circles in the figure indicate cross-section area ratio and drag coefficient of the cylinder. The drag coefficient is almost constant when cross-section area ratio is up to 0.4. When the ratio exceeds 0.4, the drag coefficient increases. When the ratio exceeds 0.6, the drag coefficient dramatically increases.
In Figure 3.5, the worst solutions (shown in red circles), i.e., small cross-section ratio and large drag coefficient, are added to Figure 3.4. When cross-section area ratio is up to 0.4, there is no significant difference in drag coefficient between optimal solutions and worst solutions. When the ratio exceeds 0.4, the difference in the drag coefficient between worst solution and optimal solution increases. In other words, when the ratio is greater than 0.4, the shape affects the drag significantly.
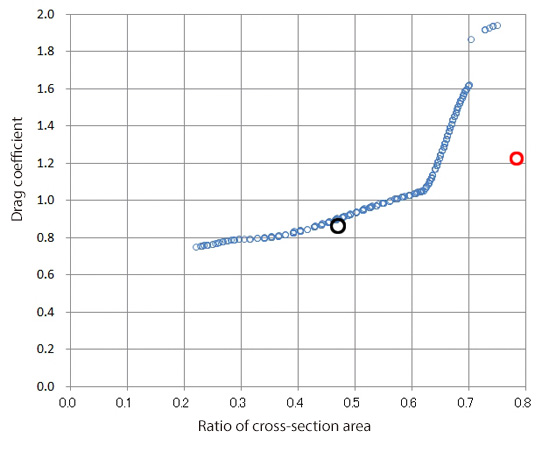
Figure 3.4: Optimal solution distribution
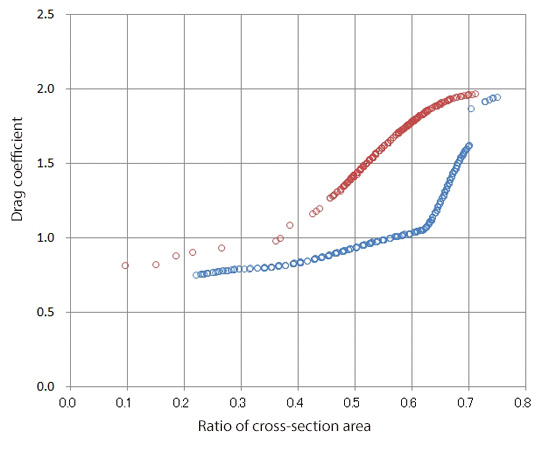
Figure 3.5: Comparison of optimal and worst solution distributions
To find the shape with which solutions become optimal, X and Y coordinates of the intermediate point of the optimal solutions are plotted. (Figure 3.6) In the figure, blue circles indicate the locations of the intermediate point of the optimal solutions while red circles indicate those of the worst solutions. When the X coordinate of the intermediate point is around the center of the object and the Y coordinate is set at approximately 30% of the representative length, the shape with which cross-section area ratio is large and drag coefficient is small is obtained. Then, an elliptic cylinder whose short axis is 60% of its long axis is created as a proposed optimal shape and the drag coefficient is analyzed. (See Figure 3.7.) Cross-section area ratio and the drag force are indicated by the black circle in Figure 3.4 and the drag coefficient is about 2/3 of the cylinder. Thus, the drag coefficient of an elliptic cylinder whose short axis is equal to the diameter of the circular cylinder and long axis is 5/3 of the diameter of the circular cylinder is approximately 2/3 of the drag coefficient of the circular cylinder. Drag force is proportional to the square of velocity. If the cross-section area in the flow direction and a force required for moving are proportional to each other, when compared to the circular cylinder, the elliptic cylinder can move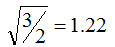 times faster.
Figure 3.8 shows velocity distribution with the proposed optimal shape while Figure 3.9 shows pressure distribution for the same. In Figure 3.8, wake flow is generated at the rear of the elliptic cylinder and the width of the wake is the same as that of the elliptic cylinder. This means that the shape of the object’s rear part does not significantly affect the flow. In other words, drag force does not greatly differ between the optimal shape and the worst shape. In Figure 3.9, positive pressure can be seen in the flow of the object’s front side and the impinging point, and negative pressure occurs at the rear of the object. This force, by which the object is pulled in the flow direction due to the negative pressure, is the profile drag described in No.4 Search for an object shape with the minimum drag force against a fluid (1).
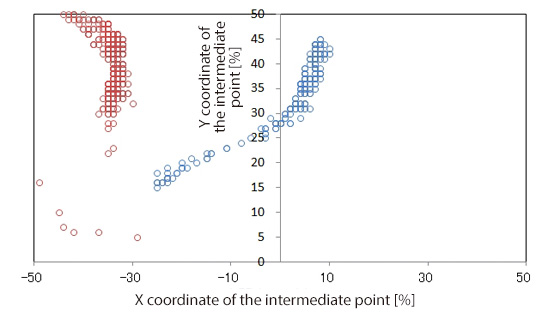
Figure 3.6: Position of the intermediate point to give optimal solutions
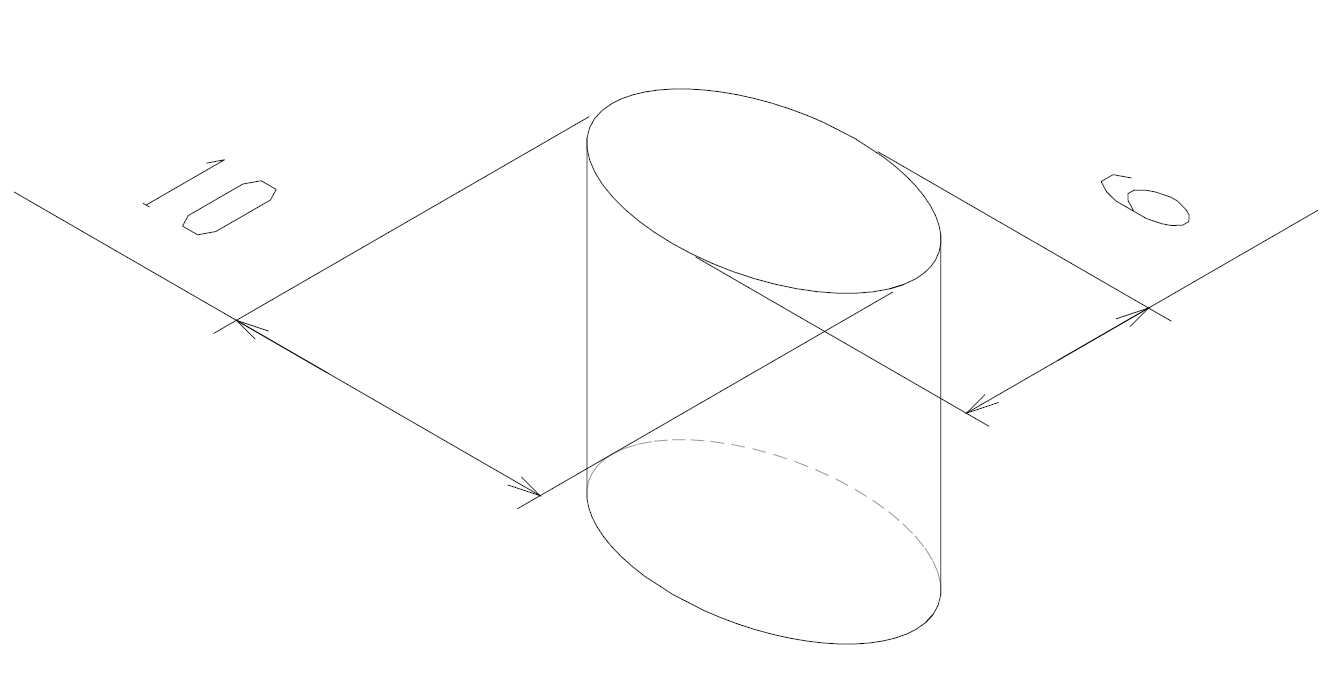
Figure 3.7: Proposal of optimal shape
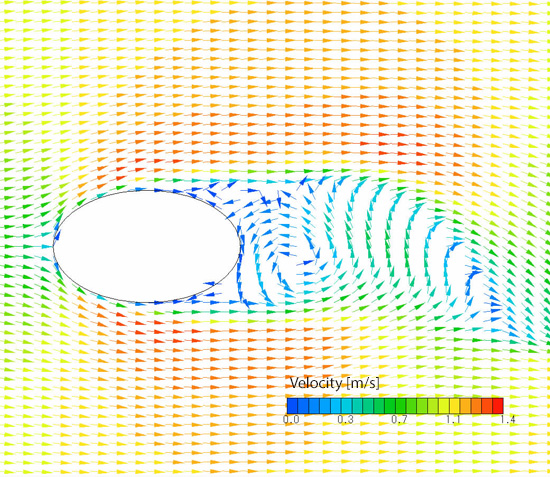
Figure 3.8: Velocity distribution with optimal shape
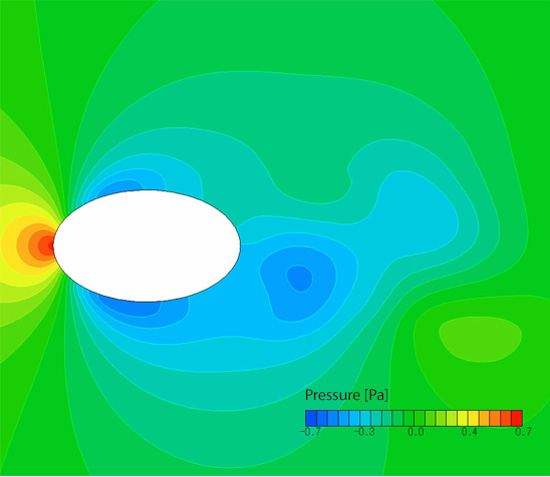
Figure 3.9: Pressure distribution with optimal shape
The next column will explain about optimal solutions when Reynolds number is 650,000.
[Reference] Kikaikougaku binran ‘Ryutai kougaku’ (Mechanical engineering handbook, ‘Fluid engineering’),
User's Guide Optimization (Option)

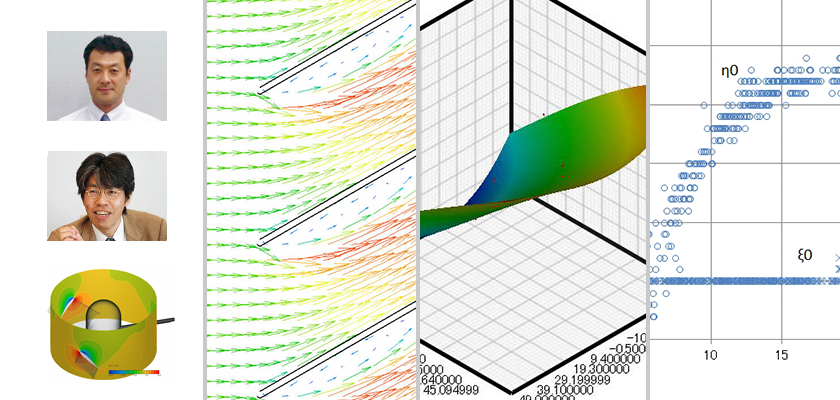
About the Author
Professor Gaku Minorikawa | Faculty of Science and Engineering,
Department of Mechanical Engineering, Hosei University
Certified environmental measurer (noise and vibration)
- 1992 Joined EBARA CORPORATION
- 1999 Became an assistant at Hosei University Faculty of Engineering
- 2001 Obtained Doctor of Engineering at Tokyo Institute of Technology
- 2004 Became Assistant Professor at Hosei University Faculty of Engineering
- 2010 Became Professor at Hosei University Faculty of Science and Engineering

About the Author
Takahiro Ito | Senior Researcher, ORIENTAL MOTOR Co., Ltd.
- 1982 Graduated University of Tsukuba (College of Engineering Sciences) and joined Nippon Steel Corporation, where he worked on the development of heating and cooling facilities.
- 1988 Joined ORIENTAL MOTOR Co., Ltd. and worked on the design and development of ventilator vanes and frames.
- 2008 Obtained Doctor of Engineering at Hosei University.
- He is Senior Researcher of ORIENTAL MOTOR Co., Ltd. (as of January 2014).

