
Case Study – Learn about Thermo-Fluid Analyses Optimization No. 4: Search for a shape with minimum fluid drag (1)
Search for a shape with minimum fluid drag (1)
A force called ‘drag force’ acts on an object in a fluid along the flow of the fluid. The larger an object, the greater the drag force which the object receives. Besides, the magnitude of drag force depends on an object shape. This means there must be an object large in volume with a small drag force. In this column, we will search for such an object shape by using EOopti.
The procedure for the search is as follows: To simplify the analysis, a 2D analysis is used, and a drag coefficient of a pillar whose cross section is an arbitrary shape is obtained. The cross-sectional area must be as large as possible with the smallest drag coefficient. The cross-sectional area is expressed as a dimensionless number using its ratio to the area of a square whose side length corresponds to the characteristic length of the cross section.
In addition, the optimal shape is searched for using different Reynolds numbers to compare each optimal shape for different fluid viscosities and object sizes. For example, consider a small insect moving at a relatively low speed and a big automobile traveling at a high speed. The optimal shape may differ from each other.
Before starting the analysis, let us describe two keys of this optimization, drag coefficient and Reynolds number, briefly. Drag coefficient CD is expressed with the following equation:
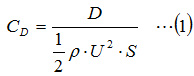
where,
D: Drag force [N],
ρ: Density of a fluid [kg/m3 ],
U: Relative velocity of an object and a fluid [m/s], and
S: Projected area of an object in the flow direction [m2].
The projected area S can be obtained by using CAD, and the drag force D can be obtained from a CFD analysis using SC/Tetra. The relative velocity U equals the inflow velocity of a boundary condition set in SC/Tetra. For the density ρ, the material property of air is used.
Here, let’s see how SC/Tetra calculates drag force. Drag force is classified into the following types:
- Friction drag (Friction caused by viscosity on an object surface)
- Profile drag (Force due to pressure difference caused by a flow separation)
- Induced drag (Force caused by longitudinal vortices)
- Wave drag (Force caused by shock waves or waves on the water surface)
- Interference drag (Force interacting between objects)
In this column, friction drag and profile drag are considered. Friction drag indicates the flow-direction component of the shear force acting on an object surface, which is output by SC/Tetra. In the same manner, profile drag indicates the flow-direction component of the pressure force acting on an object surface.
To analyze a phenomenon using SC/Tetra, the phenomenon must be modeled. The analysis model of this column is shown in Figure 1.1. First, create a flat board with a hole at its center. The cross section of the hole is an arbitrary shape. Then, the flat board region is considered as air, and the air flow around the hole of arbitrary cross section is analyzed. This is a type of wind tunnel experiments on the computer, and called a computational wind tunnel analysis.
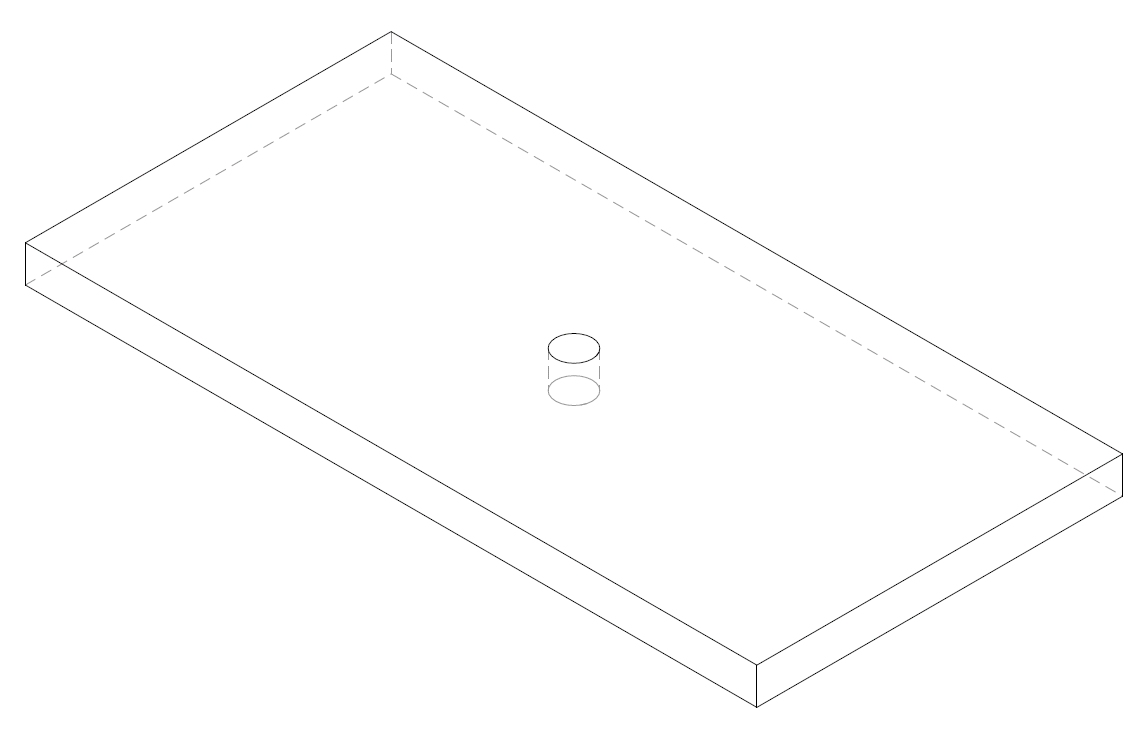
Figure 1.1: Computational wind tunnel model
The Reynolds number Re is expressed as follows:
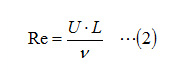
where,
U: Relative velocity of an object and a fluid [m/s],
L: Characteristic length of an object (The reference value of an object size. For a cylinder, its diameter is the characteristic length.) [m], and
v: Kinematic viscosity coefficient [m2/s].
A Reynolds number indicates the ratio of inertial force to viscous force of a flow. The inertial force acts to increase the degree of turbulence, and the viscous force acts to decrease it. When Reynolds numbers of two flows are equal, the two flows follow the same pattern. Therefore, in an analysis, set conditions for the model so as to use the same Reynolds number as that of the real flow. In this analysis, the model is analyzed with two different conditions: One is to make the model size 10 times smaller than the original. The other is to make the model size 10 times larger and the flow velocity 10 times faster than the original model. That is, the Reynolds numbers of the flows with the two conditions are 1,000 times different (100 times in size × 10 times in velocity).
Next, let’s see how to create an arbitrary shape. EOopti requires a model shape in advance for the Design of Experiments (DOE). In this analysis, for an arbitrary shape, a cross sectional shape as shown in Figure 1.2 is created, even though it is not a completely free shape. First, draw a spline curve from one edge of the line of the characteristic length to the other edge. The curve must pass a point in the range of -D/2 ≤ X ≤ D/2 and 0 < Y ≤ D/2. Next, copy the curve and flip it horizontally so that the shape’s center line in the flow direction will be the axis of symmetry. To obtain the optimal solution, with which the ratio of the board area to the arbitrary-shaped cross sectional area will be the largest and the drag coefficient will be the smallest, use X and Y coordinates of the point as design variables. Objective functions are the following two parameters: the ratio of the arbitrary cross sectional area to the square whose side length is the characteristic length of the arbitrary-shaped cross section, and the drag coefficient of the pillar with the arbitrary-shaped cross section. Note that the minimum value of Y-coordinate of the point must be greater than 0 because Y=0 will not create a curve but a straight line.
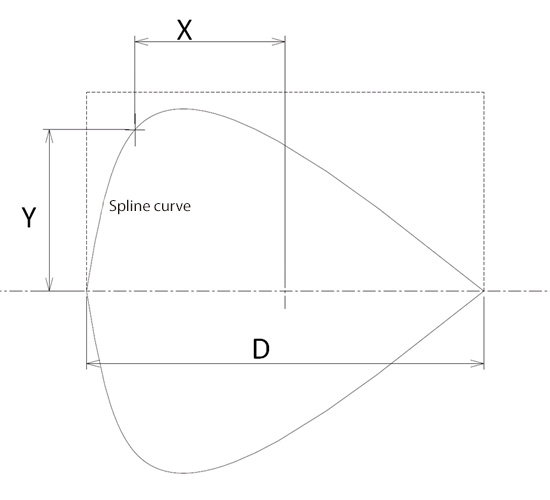
Figure 1.2: Cross sectional curve of an arbitrary shape
The next column will describe how to create a model and set conditions.
[Reference] Kikaikougaku binran ‘Ryutai kougaku’ (Mechanical engineering handbook, ‘Fluid engineering’),
User's Guide Optimization (Option)

About the Author
Professor Gaku Minorikawa | Faculty of Science and Engineering,
Department of Mechanical Engineering, Hosei University
Certified environmental measurer (noise and vibration)
- 1992 Joined EBARA CORPORATION
- 1999 Became an assistant at Hosei University Faculty of Engineering
- 2001 Obtained Doctor of Engineering at Tokyo Institute of Technology
- 2004 Became Assistant Professor at Hosei University Faculty of Engineering
- 2010 Became Professor at Hosei University Faculty of Science and Engineering

About the Author
Takahiro Ito | Senior Researcher, ORIENTAL MOTOR Co., Ltd.
- 1982 Graduated University of Tsukuba (College of Engineering Sciences) and joined Nippon Steel Corporation, where he worked on the development of heating and cooling facilities.
- 1988 Joined ORIENTAL MOTOR Co., Ltd. and worked on the design and development of ventilator vanes and frames.
- 2008 Obtained Doctor of Engineering at Hosei University.
- He is Senior Researcher of ORIENTAL MOTOR Co., Ltd. (as of January 2014).

