Master Course for Fluid Simulation Analysis of Multi-phase Flows by Oka-san: 21. Boiling flow analysis (free surface flow analysis with phase change)
Boiling flow analysis (free surface flow analysis with phase change)
Boiling flow analysis is an example of gas-liquid two-phase flow analyses. By using recent computers that have evolved dramatically, issues concerning multi-phase flows have come to be solved by fluid simulation analyses. However, there are multi-phase flow phenomena for which analysis is still difficult. One of them is a boiling flow. Boiling flows are widely used in industrial fields such as heat exchangers and cooling systems. They are complex flows whose flow pattern varies according to the temperature difference between the liquid and the heat transfer surface, etc. In a micro approach of a boiling flow, modeling of generation of bubble cores on the heat transfer surface and growth/separation of these bubbles is required, however, there is no analysis method that has been established universally. Therefore, consider a macro approach instead.
As shown in Figure 1, a boiling flow is analyzed with the VOF method for free surface flow analyses and the phase change between evaporation and condensation is modeled with increase and decrease of the F value (volume fraction of fluid). At the same time, increase and decrease of the latent heat and volume (density difference between a liquid and a gas) is considered. These increase and decrease can be represented in a model established by Lee (a series of basic equations concerning evaporation and condensation proposed in 1980) in Los Alamos National Laboratory in the U.S., assuming the local balance. In the model of Lee shown in Figure 2, it is assumed that evaporation occurs when the liquid temperature of each fluid element is higher than the saturation temperature (boiling point) and condensation occurs when it is lower than the saturation temperature, and the phase change volume is calculated in consideration of the densities of the gas and liquid.
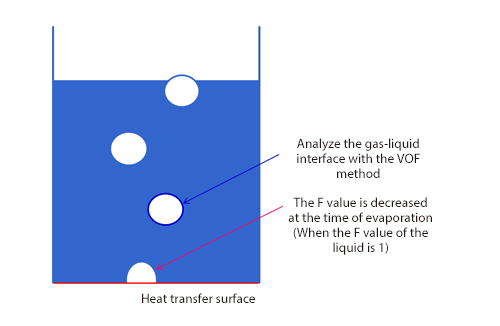
Figure 1: Modeling of boiling flow
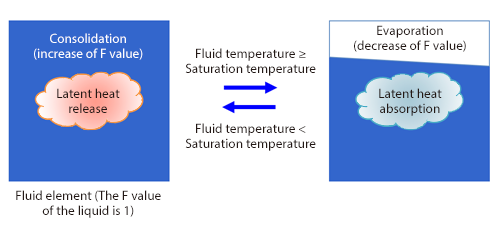
Figure 2: Model by Lee
Here is an analysis example. The series of analyses was conducted by Satoshi Maeda in our Engineering Department. First, Figure 3 shows an example in which the phase change from liquid phases to gas phases was analyzed by heating the bottom of a square container with water in it. The surface with a VOF value of 0.5 is represented with an isosurface. It shows that gas phases (bubbles) are generated when the bottom is heated and the bubbles go up with buoyancy.
Figure 3: Example when bottom of container is heated
In the phase change from a gas phase to a liquid phase, the density of the substance changes. Since a gas phase has a lower density than a liquid phase, when the phase is changed from a liquid phase to a gas phase, the internal pressure increases accordingly. As an analysis example of such a closed space, analysis of a vacuum coffee maker was conducted as shown in Figure 4. As in the case of Figure 3, the bottom of the flask is heated. The actual flask of a vacuum coffee maker has mixture of air and steam in it, however, it has only steam in this example. It shows that bubbles are generated in the flask below and water goes up through the narrow pipe in the middle at the same time. Since the flask has a closed space, it is presumed that the internal pressure is increased with evaporation of water, pushing up the water in the flask. (In the figure on the left, the color below the interface is the color of coffee.)
Figure 4: Vacuum coffee maker (left: isosurface with VOF value of 0.5, right: pressure distribution)
Finally, an analysis example with a model of an heat pipe with a flow is introduced. In this model, there is a heat pipe with a diameter of 3 mm on a tabular solid, and the phase change in the pipe is analyzed. Water enters the pipe from the inlet on the front side at the speed of 0.1 m/s and flows out of the outlet on the back side. You can see that the solid is heated up gradually and gas phases are generated from the lower part of the pipe and flow. The gas phases become larger as heating continues and come to occupy the most space in the pipe.
Figure 5: Analysis example of heat pipe (contour: temperature distribution)
The next section will explain a two-fluid model.

About the Author
Katsutaka Okamori | Born in October 1966, Tokyo, Japan
He attained a master’s degree in Applied Chemistry from Keio University. As a certified Grade 1 engineer (JSME certification) specializing in multi-phase flow evaluation, Okamori contributed to CFD program development while at Nippon Sanso (currently TAIYO NIPPON SANSO CORPORATION). He also has experience providing technical sales support for commercial software, and technical CFD support for product design and development groups at major manufacturing firms. Okamori now works as a sales engineer at Software Cradle.

About the Author
Satoshi Maeda | Born in March 1985, Wakayama, Japan
He has attended Kyoto University Graduate School of Science and attained Ph. D in Physics and Astronomy, where he pursuit theoretical research of magnetic field generation in early Universe. Having joined Software Cradle, he has been providing technical support to current users and helped with analysis services as a consulting engineer.

