
Master Course for Fluid Simulation Analysis of Multi-phase Flows by Oka-san: 16. Dew condensation analysis III
Dew condensation analysis III
This section continues the introduction of dew condensation (evaporation) analysis.
The Particle Tracking Method described in this column is combined with the dew condensation analysis. As shown in Figure 1, a water droplet is converted into a condensation amount on a wall surface. Converted particles are extinguished and not tracked any more. The water that builds up condensation on the wall surface remains at rest. It will be evaporated when the absolute humidity in the air is smaller than the saturated absolute humidity of wall temperature.
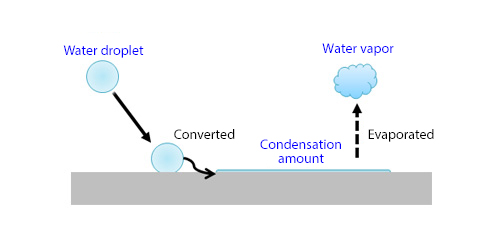
Figure 1: Conversion of water droplet into condensation amount
Here is an analysis example. It analyzes mist spray, which we see in parks or theme parks during the summer season.
The analysis target is an open space where a sunshade of 10 x 13 m is located as shown in Figure 2. As for the ground, asphalt tiles are laid to a depth of 2 cm, and asphalt is laid to a depth of further 20 cm. The columns and roof of sunshade are made of stainless steel and slate, respectively. A mist nozzle is installed to the asphalt tile beside the sunshade.
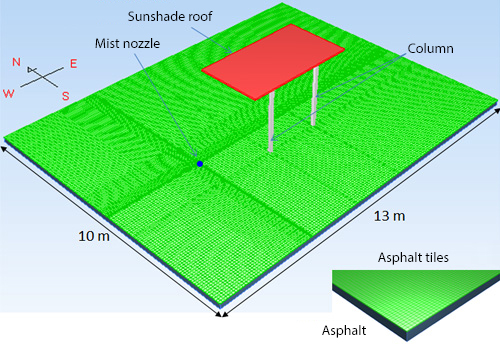
Figure 2: Open space with sunshade
The location is Yokohama on the sunny day of August 1st. Insolation including sky insolation is analyzed between 7:00 am and 1:00 pm. The top surfaces of asphalt tiles and sunshade roof are coated with a paint having a solar absorptance of 0.4 (transmittance: 0). The initial conditions for temperature and relative humidity at 7: 00 am are 25.7° C and 70%, respectively. The power-law flow velocity conditions (flow velocity 2.0 m/s at a standard height of 19.5 m, flat area) are set assuming that wind blows continuously from the southeast. Also, a relative humidity of 70% and temperature are added to the flow velocity conditions, and the temperature is assumed to change with time as shown in Figure 3.
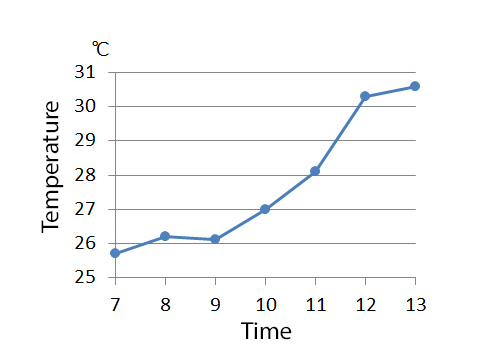
Figure 3: Temperature change with time added to flow velocity conditions
Figure 4 shows the asphalt tile temperature distribution changing with time. As shown in the figure, the temperature reaches and exceeds 50° C at 12:00 (it seems impossible to walk barefoot). It also shows that the shadow of sunshade roof helps to decrease the temperature in the central area of open space to 40° C or lower.
Figure 4: Asphalt tile temperature distribution changing with time
Next, application of mist spray is attempted for ten minutes from 12:00 to obtain the water sprinkle effect (decrease the ground temperature through the heat generated in water evaporation) by attaching mist to the asphalt tiles to build up condensation, not by floating mist in the air. Mist consisting of water droplets with a diameter of 120 µm is sprayed at a flow rate of 1.5 L/min from the mist nozzle toward the sky in the vertical direction at a spraying angle of 90° . The mist that dropped and attached to the asphalt tiles is converted into a condensation amount.
Figure 5 shows the mist and condensation distribution that changes with time for a period of 60 seconds from applying mist spray. It shows that the mist attached to the asphalt tiles is converted into a condensation amount. On the other hand, Figure 6 shows the asphalt tile temperature distribution that changes with time while mist spray is applied. You can see that the temperature is decreased to 40° C or lower by the water sprinkle effect and the effect persists even after finishing mist spray at 12:10.
Figure 5: Mist and condensation distribution changing with time
Figure 6: Asphalt tile temperature distribution changing with time while mist spray is applied
Note that the animation in Figure 4 and 6 are 1200 times faster than the normal time, and Figure 5 is 20 times faster than the normal time.
With this column, the introduction of dew condensation analysis is completed. As described above, the condensation analysis can consider condensation/evaporation on a wall surface, moisture absorption/desorption within a solid substance, conversion of water droplet into condensation amount on a wall surface, etc. These features enable application to various analysis targets.
The next column will introduce an analysis example.

About the Author
Katsutaka Okamori | Born in October 1966, Tokyo, Japan
He attained a master’s degree in Applied Chemistry from Keio University. As a certified Grade 1 engineer (JSME certification) specializing in multi-phase flow evaluation, Okamori contributed to CFD program development while at Nippon Sanso (currently TAIYO NIPPON SANSO CORPORATION). He also has experience providing technical sales support for commercial software, and technical CFD support for product design and development groups at major manufacturing firms. Okamori now works as a sales engineer at Software Cradle.

