
Master Course for Fluid Simulation Analysis of Multi-phase Flows by Oka-san: 15. Dew condensation analysis II
Dew condensation analysis II
This article introduces another example of dew condensation/evaporation analysis.
When you want to analyze dew condensation and evaporation on a wall surface of a solid such as a window inside the house or a defroster, the amount of vapor in the air, i.e., humidity, can be considered, and dew condensation and evaporation can be calculated based on the difference between absolute humidity in the air near the wall surface and absolute humidity at saturation at the wall temperature. However, when you analyze moisture absorption and desorption of a solid such as a humidity-controlling material (or humidity conditioner), you need to set the moisture absorption/desorption properties of the solid.
Figure 1 shows an example of a solid with voids, or a porous medium. Moisture in a solid transfers when water permeates in the solid and water vapor diffuses. When the relative humidity inside a solid is 98% or smaller, it is assumed that the form of moisture transfer is water vapor diffusion, and moisture conductivity of the solid is set as one of its material properties. In addition, moisture transfer between a solid surface and air is approximated by calculating the moisture transfer coefficient from the heat transfer coefficient of convection between the solid surface and the fluid using the Lewis number Le, which is a dimensionless number defined as the ratio of transfer speed between heat and mass. This is called the Lewis relation.
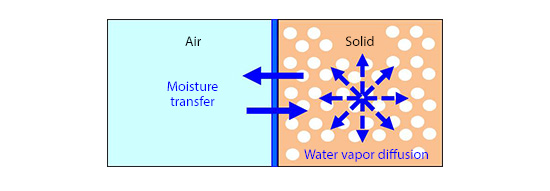
Figure 1: Humidity in a solid
At the same time of moisture transfer in a solid, a phase change between water vapor and water occurs inside the solid as shown in Figure 2. Water vapor condenses into water and water evaporates and changes to water vapor. Since heat generation and absorption corresponding to latent heat due to the phase change affects the phenomenon, transfer of moisture and heat in the solid requires to be simulated in a coupled analysis. For the coupled analysis, the amount of moisture required to change the humidity of the solid (absolute humidity) and the amount of moisture required to change the temperature of the solid are set as the moisture absorption/desorption properties of the solid.

Figure 2: Moisture absorption/desorption in a solid
Here, let us see an analysis example. This time, a bathroom drying system is analyzed. Recent modular bathrooms have been equipped with a bathroom drying system useful to dry laundry on a rainy day.
As shown in Figure 3, the analysis target is the inside of a bathroom. A bar is horizontally installed near the ceiling, and a piece of laundry is hung on it. The piece of the laundry is 126 cm long by 60 cm wide by 1 cm thick. Its porosity in the dry state is 0.4, the apparent density with the consideration of the porosity is 1.30 kg/m3, the specific heat is 1.15 kJ/(kg∙K), and the thermal conductivity is 0.086 W/(m∙K). The moisture conductivity is 5.0×10⁻⁶ kg/(m∙s(kg/kgDA)), the amount of moisture required to vary the absolute humidity is 5.0×10³ kg/(m3 (kg/kgDA)), and the amount of moisture required to vary the temperature is 2.5 kg/(m3 ∙K). Note that (kg/kgDA) is the unit of absolute humidity and DA stands for dry air.
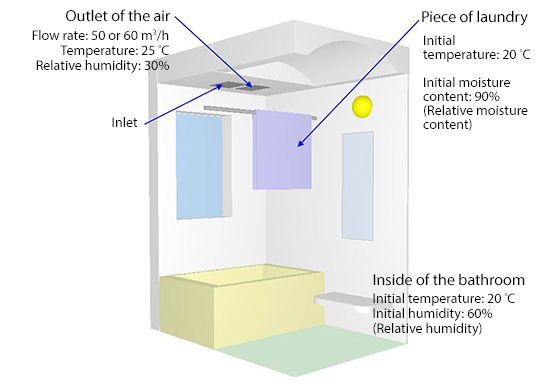
Figure 3: Laundry drying system in the bathroom
For the air blown out from the outlet on the ceiling of the bathroom, parameters are set as follows: inflow rate to 50 m3/h, temperature to 25° C, and relative moisture content to 30%. The initial temperature of the bathroom including the laundry is 20°C, the initial relative moisture component of the laundry is 90%, and the initial relative humidity in the bathroom is 60%. Considering buoyancy due to temperature difference, moisture transfer between the laundry surface and the air follows Lewis relation. Figure 4 shows the time variation of temperature distribution on the laundry surface and a cross section of the bathroom, while Figure 5 shows the time variation of relative humidity distribution on the laundry surface. How the laundry dries in a bathroom drying system is well simulated.
Figure 6 shows the time variation of temperature distribution on the laundry surface and a cross section of the bathroom when the flow rate of the air from the outlet is increased to 60 m3 /h, while Figure 7 shows the time variation of relative humidity on the laundry surface with the same flow rate as Figure 6. Figure 7 indicates that larger flow rate of the air helps the laundry dry faster. Note that the animation speed of Figures 4 to 6 is 600 times faster than real time.
Figure 4: Time variation of temperature distribution
Figure 5: Time variation of humidity distribution
Figure 6: Time variation of temperature distribution (with larger flow rate)
Figure 7: Time variation of humidity distribution (with larger flow rate)

About the Author
Katsutaka Okamori | Born in October 1966, Tokyo, Japan
He attained a master’s degree in Applied Chemistry from Keio University. As a certified Grade 1 engineer (JSME certification) specializing in multi-phase flow evaluation, Okamori contributed to CFD program development while at Nippon Sanso (currently TAIYO NIPPON SANSO CORPORATION). He also has experience providing technical sales support for commercial software, and technical CFD support for product design and development groups at major manufacturing firms. Okamori now works as a sales engineer at Software Cradle.

