
HeatPathView: Development Background
Jun Eto (Software Cradle, Software Engineering Dept.)
HeatPathView: Development Background
HeatPathView was developed for version 10 as a visualization utility to display analysis results from scSTREAM and HeatDesigner. HeatPathView enables users to manage heat dissipation at the component level. It is a productivity tool that makes it possible to search and understand heat balances and heat paths in an intuitive graphical format. The following interview with Software Cradle's developer Jun Eto, reveals the drivers behind the development of HeatPathView, a feature born from the need "to determine the breakdown of heat transfer to help engineers make more informed thermal design decisions."
 Jun Eto, Software Cradle, Co., Ltd., Tokyo Branch, Software Engineering Dept.
What Do you Think of the Utilization of Thermo-fluid Analysis Tools of Late?
In talking with our users, I hear them say thermal design requirements have become more stringent in recent years with companies in constant pursuit of innovation. These engineers are faced with ever increasing thermal densities in designs that are smaller and in many cases are "fan-less" structures. Circuit boards are more densely populated with components that in many cases are producing more heat.
This is driving the adoption of thermo-fluid analysis software in the market, and with ever decreasing product design cycles CFD software has become a required tool to tackle today's thermal design challenges. Products like scSTREAM and HeatDesigner can tackle those challenges, making it possible to change materials, or the layout of components within the software and simulate the temperature and thermal effect of heating components, before prototyping and testing. Another valuable insights that can be derived from doing a thermal analysis, are that you can measure the temperature in areas that are hard to reach, you can also visualize the air flow, which is hard to do in experiments, and you can share results easily with your fellow design engineers or clients. However, there are more problems to be solved in terms of practical use of the software. During technical support sessions with our users, I am often asked, "I got the results, but how can I apply them to my product design for improvements?" This was the case where the users were unable to utilize the results of temperature distribution of their products to improve their designs effectively, and the role of the analysis tools was limited to checking if components meet specifications. Of course, that's an important role, but it's an extension of actual measurements, and I couldn't say the analysis tools were fully utilized.
Figure 1. Difficulty connecting analysis results and design ideas
In light of this, I became increasingly convinced that some ingenuity with respect to how analysis results are presented should help create ideas about design improvements directly from the analysis results.
We also hear engineers talk about "front-loading design." It is a strategy to design with logic early in the conceptual stage while there is still a lot of freedom and flexibility. Although it is often talked about, the truth is it is not quite a reality. In the preliminary design phase, a lot of parameters including structure and power consumption are tentative, making the analysis results tentative as well. At this stage an absolute evaluation of temperature doesn't mean much and so a comparative or parametric evaluation of study should be performed. However, discussions tend to focus on the differences from measured or designed values, presumably because the analysis tools aren't capable of providing visualization. Nonetheless, I suppose it is also true that a comparative evaluation can't bring about enough effects to front-loading design every time, as temperature margins are small due to denser packaging.
Whether it is in preliminary design phase or in detailed design phase, if analysis results are relegated to "This component is at XX degrees C," only information design engineers derive from the analysis is whether a given component will have a problem compared to the measured or designed value. So, I've come to believe that it is essential to have the software deliver an answer to the question, "How come this component is at XX degrees C?"
And to do so, I came to a conclusion that it is necessary to graphically show the flow of heat in a way that is easy for engineers to understand.
For example, Figure 2 shows temperature distributions of two different circuit boards with a BGA mounted to it. As far as the temperature distribution goes the two cases don't appear to be very different. However, when we are able to examine how the heat dissipates from the BGA we see there is a large amount of heat dissipation to the air on the left, while there is a fair amount of heat dissipation through radiation on the right. For the purpose of thermal dissipation management, it is more important to know the cause (flow of heat) than to know the result (temperature).
You can obtain detailed temperature distributions in experiments using devices like thermography, but it is difficult to measure the amount of heat transfer. I suspect in many cases, design engineers measure temperature at multiple locations and use this information to picture in their heads of how the heat flows. I thought if we could show this process as an analysis result, it would help create ideas about design improvements more directly from analysis results.
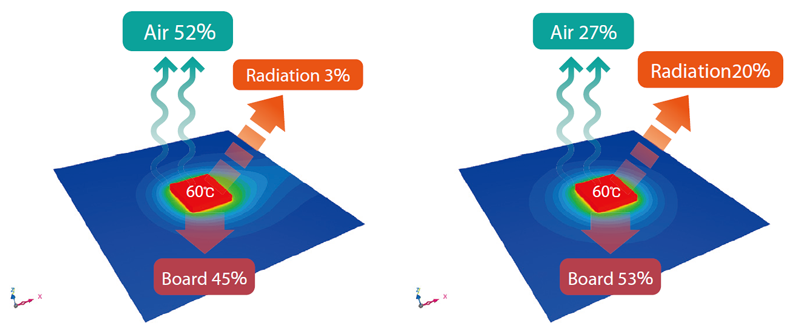
Figure 2. Temperature distribution of the board and illustration of heat dissipation
So this is Why you Developed HeatPathView?
Right. Actually, heat transfer is calculated in the course of obtaining results in any thermo-fluid analyses. So we already had the ingredients to visualize the flow of heat. In addition to the traditional analysis tools that give results (temperature), visualizing the heat flow allows for a more active approach toward thermal design/management by providing an understanding of the cause (flow of heat) of the results.
This "tool for understanding the cause of component temperature" is HeatPathView.
Tell us About your Efforts or Innovations in the Development
I stopped to think about how to visualize the flow of heat in an easily comprehensive way. From the word 'flow', things like showing vector plots in postprocessors quickly come to mind, but I thought we needed an interface that helps us understand the whole picture more easily. In the area of thermal design, there are some methods other than CFD to calculate temperature, such as hand calculations using empirical formulas or by creating thermal networks. The downside to these approaches is that they can't show any detailed distributions as outputs, but I have long felt they offer the advantage of being simple and easy to understand. CFD of course has very detailed, element-level information, but it is not necessarily easy for the users to understand the whole picture. I thought we should turn element level CFD information into one-dimensional thermal network information, and provide a way to visualize it.
Next, I wanted to arrange the information in words and terms familiar to design engineers. I thought if we could report analysis results in heat-transfer engineering terminologies, such as the 'three fundamental forms of heat transfer (conduction, convection, and radiation)', 'heat path', and 'thermal resistance', then analysis results could be more approachable for design engineers.
Lastly, I make sure it would be highly usable. With the improving performance of computers, the scales of analysis are getting larger every year. Users are conducting analyses with hundreds of millions of elements, and it's expected the scales will continue to get larger, so I set out to make this tool be able to show results as quickly as possible regardless of analysis scales.
With these objectives, we developed a beta version of the tool. Then, we brushed up the details and we asked some of our clients to use the beta version. We interviewed them for comments and feedback and incorporated these improvements at release 10.
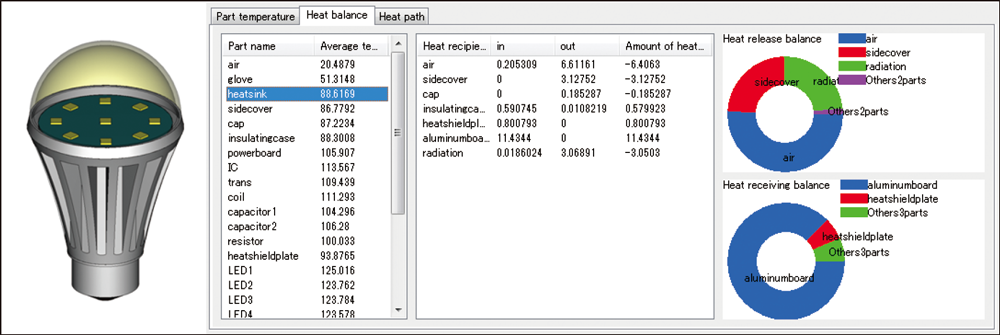
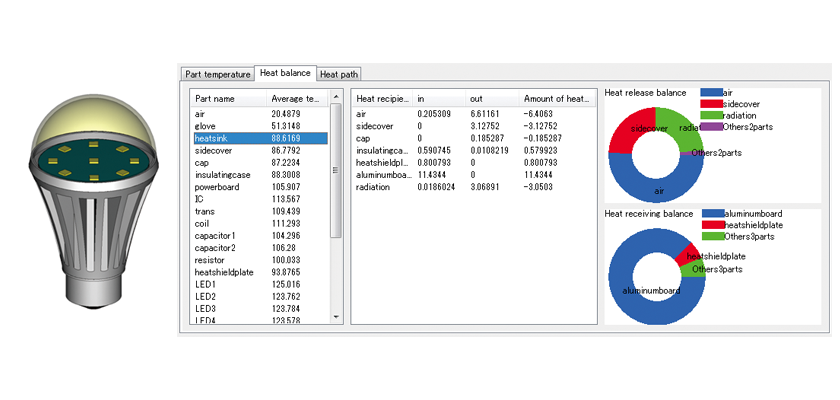
Figure 3. Heat dissipation/reception balance of the heat sink
What are the Features of HeatPathView, and How Can We Use Them?
HeatPathView has mainly three features. I'd like to introduce those features using an example of an LED light bulb analysis. First, the [Part temperature] tab shows the list of maximum and average temperature, amount of heat generation, and material name for each component. Here, you can check if the component of interest meets its temperature margin, or if there are any components with unexpectedly high temperatures. Moreover, you can get temperature rise per watt and density of heat generation, which can help you compare heat dissipation capabilities of components with different amounts of heat generation.
Next, in the [Heat balance] tab, you can see how much heat is dissipated from the component of interest and to which components receive the dissipated heat. Conversely we can see which components are dissipating heat to our component of interest. Figure 3 shows the heat dissipation and reception balance for the heat sink. You can see that it receives heat from the aluminum board, and fifty percent of that heat is lost to the air through convection, twenty five percent to the side cover through conduction, and another twenty percent through radiation. Knowing heat dissipation balance helps us make guidelines for an effective thermal management tailored to the situation. It is difficult from measurements to know which of the 'three fundamental forms of heat transfer', that is, conduction, convection, and radiation, are responsible for the heat dissipation. This is the kind of output truly unique to analysis.
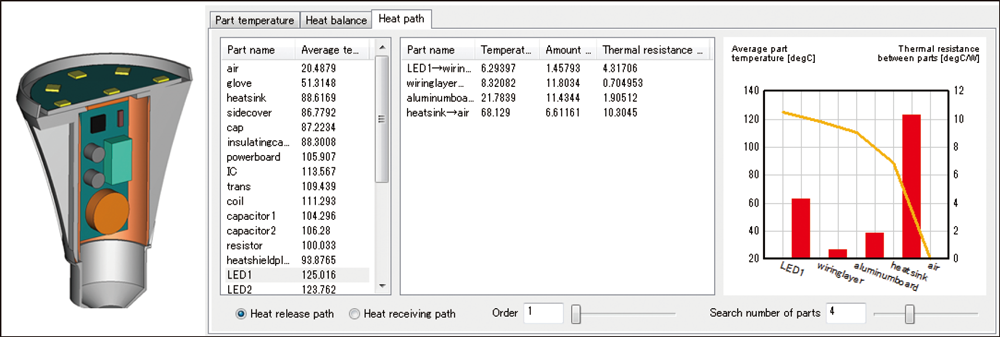
Figure 4. Heat path from the LED device
Lastly, there is the [Heat path] tab. In the [Heat path] tab, you can view the heat dissipation path from the component of interest. Figure 4 shows the primary heat path from the LED device. You can see the heat is transferred to the air from the LED device, through the board, then through the heat sink. Because the basics of thermal design and thermal management tell us to reduce thermal resistances in the heat path, we decided to show not only the temperature of components along heat paths but also values derived for the concept of thermal resistance between components. This enables us to easily judge which part of a heat path countermeasures are effective. In addition to the primary heat path, you can explore the secondary or a the third heat path by switching over the sliding bar, and pick out a heat path or a part of it that's being the bottleneck. For those components that generate heat, it is important to know the bottleneck in heat path like this. On the other hand, for those components that generate no heat and are thermally susceptible, it is important to know heat reception paths. In HeatPathView, the display can be easily switched between heat dissipation and reception path, and for those components, checking their heat reception paths helps us find a location to give a countermeasures for shutting off heat reception.
Before Ending, Please Give a Message to the Users
HeatPathView enables you to view analysis results from a new perspective, that is, from the vantage point of "Heat Flow". And we fully expect a new perspective to bring new discoveries. I hope you will take a look at your analyses in the past from this perspective. It will give me a great pleasure if this tool will be of some help to the engineering community when it comes to thermal design and management.
*All product and service names mentioned are registered trademarks or trademarks of their respective companies.
*Contents and specifications of products are as of November 28, 2012 and subject to change without notice. We shall not be held liable for any errors in figures and pictures, or any typographical errors.
Download

