
Case Study – Learn about Thermo-Fluid Analyses Optimization No. 1: Shape optimization for a can (1)
Shape optimization for a can (1)
Introduction
The goal of optimization is to achieve an objective by identifying the direction to the objective and developing the most appropriate plan to reach it. The steps along the path to achieve the objective are selected based on the direction and plan. Optimization is inherent to any design process. However, in recent years optimization has been sought for in many phases of the product life cycle because of the continual need to rapidly improve performance. As a result, the combination of Computer Aided Engineering (CAE) and optimization software is in the spotlight. This article introduces case studies where scSTREAM or SC/Tetra is used in combination with an optimization tool, “Extension Option (Optimization) or EOopti”, for the design of electric devices and turbo machinery. The intent of the optimization software is to enhance product performance. In addition, it provides other advantages such as visualization of the design process, acquisition of new knowledge, and accumulation of knowledge learned. This article series uses case studies to illustrate visualization of the design process using CAE and optimization software.
This first article describes optimization for the design of a can.
Optimization of a can
A can has a shape as shown in Figure 1.1. Its volume and surface area can be expressed by the following equations:
| where, D : Diameter H : Height V : Volume A : Surface area |
Material costs will be minimized when the surface area per unit volume, a function of D and H, is minimized. This calculation will reveal the optimal solution. To do this, first, rearrange equation (1) to (1)’. Then substitute (1)’ into (2). Next, solve for D while minimizing A with the condition that V is constant. When this is done, the minimum surface area occurs when H = D (the height and the diameter of the can are equal).
Figure 1.1: Shape of a can
Next, we will analyze the “joint length” of the can. The can consists of 3 pieces. These are the upper and lower disks and a cylinder made of a rectangular sheet. The major part of the can manufacturing process involves swaging, which is a cold forming process using dies. Another critical performance requirement for the can is sealing, which will depend on its joint quality. When the joint length per volume is shortest, the manufacturing costs and the risk related to reliability will be lowest. In this analysis, the calculated value of the joint length will be the optimal solution.
The joint length can be expressed by the following equation:
![]()
In a similar manner as used for the minimum area calculation, substitute H obtained from equation (1) into (3), and solve for D that minimizes L. These calculations reveal that the joint length is shortest when H = π∙D, that is, the height of the can is approximately 3 times longer than its diameter. Figure 1.2 plots the surface area and the joint length when V = 1,000 cm3 and H/D (the ratio of the height to diameter) varies from 0.5 to 5. The red circle in Figure 1.2 indicates that the height and diameter are equal. The blue circle is for a height that is 3.1 times longer than the diameter. The graph shows that the surface area is smallest at the red circle and the joint length is smallest at the blue circle. A tradeoff occurs between the surface area and joint length when the height is 1 to 3 times longer than the diameter. The optimal solution depends on which requirement has priority. If both requirements are treated equally, the shape of the can with the height 1.6 times longer than the diameter (indicated by the purple circle) can be considered the optimal shape.
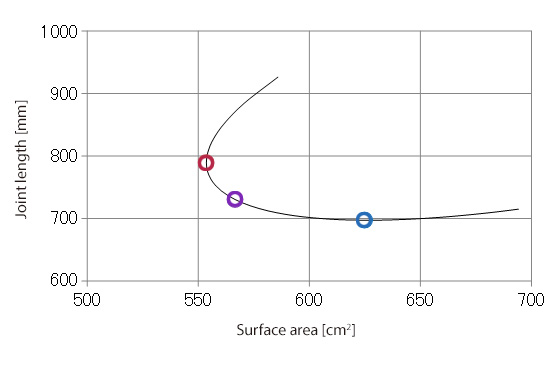
Figure1.2: Surface area and joint length when volume is 1,000 cc
As shown above, the following factors for the shape optimization can be visualized by graphing the relationship between the two design objectives for the can, i.e., the surface area and the joint length:
- For the case considered, the optimal design range occurs when the height of the can is 1 to 3 times longer than diameter)
- A tradeoff occurs between the design parameters
- In this analysis, the tradeoff was determined by treating both requirements equally
Visualization helps the engineers communicate design factors with the production and procurement teams early in the design process. The results from the analyses encourage front loading where additional resources are concentrated early in the product manufacturing process when critical decisions can be made. In addition, the analysis process also encourages the design and manufacturing teams to jointly own the design knowledge, which will continue to grow as the body of understanding grows.
In this can example, Microsoft Excel can be easily used to graph the results since the design objective was expressed by a formula. However, usually the final design objective cannot be expressed by a single formula. Here, CAE tools such as scSTREAM and SC/Tetra play essential roles. The combination of a CAE tool and an optimization tool can help provide visualization capabilities for complicated phenomena.
In this article series, we will introduce examples and methods of design visualization for electric devices and turbo machinery.
The next article will describe the use of EOopti for the can example. This will be an illustrative example and may not reflect the actual design of cans used for foods.
(Reference) User's Guide Optimization (Option)

About the Author
Professor Gaku Minorikawa | Faculty of Science and Engineering,
Department of Mechanical Engineering, Hosei University
Certified environmental measurer (noise and vibration)
- 1992 Joined EBARA CORPORATION
- 1999 Became an assistant at Hosei University Faculty of Engineering
- 2001 Obtained Doctor of Engineering at Tokyo Institute of Technology
- 2004 Became Assistant Professor at Hosei University Faculty of Engineering
- 2010 Became Professor at Hosei University Faculty of Science and Engineering

About the Author
Takahiro Ito | Senior Researcher, ORIENTAL MOTOR Co., Ltd.
- 1982 Graduated University of Tsukuba (College of Engineering Sciences) and joined Nippon Steel Corporation, where he worked on the development of heating and cooling facilities.
- 1988 Joined ORIENTAL MOTOR Co., Ltd. and worked on the design and development of ventilator vanes and frames.
- 2008 Obtained Doctor of Engineering at Hosei University.
- He is Senior Researcher of ORIENTAL MOTOR Co., Ltd. (as of January 2014).

