
Master Course for Fluid Simulation Analysis of Multi-phase Flows by Oka-san: 18. Solidification/melting analysis II
Solidification/melting analysis II
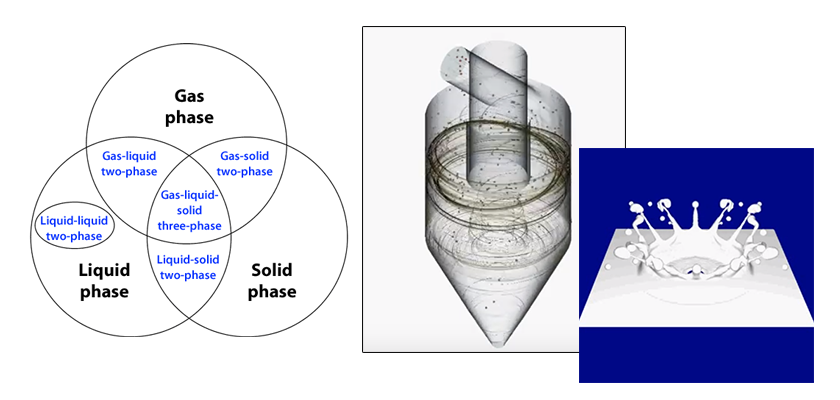
This section continues to explain solidification/melting analysis. The flow of the liquid phase in solid-liquid coexistent state is affected by the volume fraction of the solid phase (solid phase rate). In other words, the liquid phase has difficulty flowing with higher solid phase rate. If the solid-fluid interface is smooth as in the case where ice is melted by water, modeling of a fluid element is possible by analyzing it only with the temperature and the solid phase rate, with the solid phase rate of the fluid element equal to or larger than the liquid limit solid phase rate and the pressure and the speed 0 as shown in Figure 1. The liquid limit solid phase rate varies depending on the target, however, 0.7 to 0.9 may be appropriate. Figure 2 shows the speed vectors of an analysis example in which ice adhering around a solid matter is melted by running water. The fluid elements are shown with grids, and the speed vector of fixed length is shown for each element. For this analysis example, modeling with a liquid limit solid phase rate (0.9) is applied. As shown in Figure 2, the speed vectors are formed along the region with the solid phase rate of 0.9 or more.
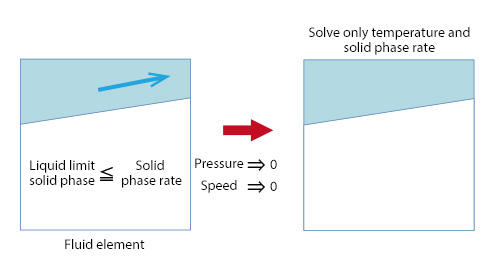
Figure 1: Modeling with liquid limit solid phase rate
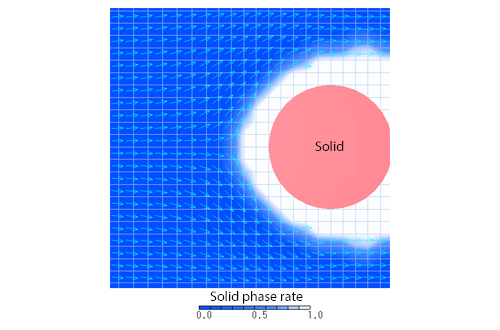
Figure 2: Speed vectors of analysis example
Here is an analysis example. Thawing of a frozen block by running water is analyzed. Marine products, etc. are transported in frozen blocks to be kept fresh. One of the thawing methods of frozen blocks is thawing by running water. Its advantage is that frozen blocks can be thawed in a short time, however, if they are thawed completely, water may drip to cause degradation of marine products, etc. Therefore, it is important to thaw by running water until the frozen blocks are thawed partially, not completely.
Figure 3 shows a frozen block (length of 266 mm, width of 170 mm, height of 50 mm) that contains 18 pieces of marine products (9 pieces in each row). The material properties of the marine products are as follows: density 900 kg/m3 , specific heat of 2000 J/(kgK), and thermal conductivity of 1.40 W/(m·K). Transient analysis is conducted, assuming that the initial temperature of the frozen block including marine products is -20°C and water of 4° C runs at the speed of 50 mm/s for 20 minutes. The liquid limit solid phase rate is 0.9.
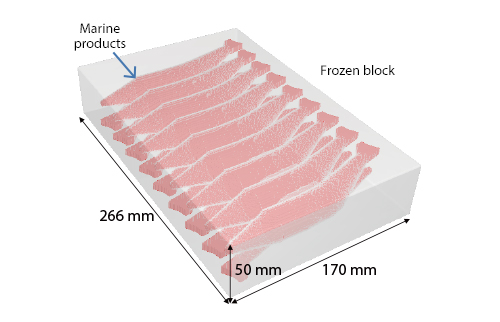
Figure 3: Frozen block
Figure 4 shows the sectional temperature change of the marine products in the upper row, and Figure 5 shows the isosurface change with a solid phase rate of 0.5. It shows that the entire marine products are thawed by water running for 20 minutes. However, the sectional temperature change shows that the temperature at end of marine products is almost 4° C, which indicates that the products are no longer partially thawed.
Figure 4: Sectional temperature change of marine products
Figure 5: Isosurface change of solid phase rate
Next, transient analysis is conducted with water of 4° C running at the speed of 25 mm/s for 20 minutes. Figure 6 shows the sectional temperature change of the marine products in the upper row, and Figure 7 shows the isosurface change with a solid phase rate of 0.5. The sectional temperature change shows that the temperature of the marine products except for the front one is 0° C, which means most of them are partially thawed. It means that the marine products can be thawed in a short time without drip of water if they are taken out of the running water at this time and left to be thawed naturally.
The times in animation in Figures 4 to 7 are accelerated by 20 times. The next section will explain solidification/melting analysis continuously.
Figure 6: Sectional temperature change of marine products (with running water speed changed)
Figure 7: Isosurface change of solid phase rate (with running water speed changed)

About the Author
Katsutaka Okamori | Born in October 1966, Tokyo, Japan
He attained a master’s degree in Applied Chemistry from Keio University. As a certified Grade 1 engineer (JSME certification) specializing in multi-phase flow evaluation, Okamori contributed to CFD program development while at Nippon Sanso (currently TAIYO NIPPON SANSO CORPORATION). He also has experience providing technical sales support for commercial software, and technical CFD support for product design and development groups at major manufacturing firms. Okamori now works as a sales engineer at Software Cradle.

